Description of the Webinar:
Join our expert panel for a conversational webinar on “The Art of Data Storytelling” and learn how to transform data into compelling narratives. This interactive session will cover the fundamentals of data storytelling, best practices in data visualization, and real-world case studies from diverse domains.
Date and Recording:
Monday, April 22, 2024
3:00–4:00 p.m. CT
Presenters:

Dr. Jonathan Schwabish is founder of the data visualization and presentation skills firm, PolicyViz, and a Senior Fellow in the Income and Benefits Policy Center at the Urban Institute, a nonprofit research institution in Washington, D.C. Dr. Schwabish is also a member of Urban’s Communications team, where he specializes in data visualization and presentation design. His research agenda primarily includes nutrition policy and policies that affect people with disabilities. Dr. Schwabish is considered a leader in the data visualization field and a leading advocate for clarity and accessibility in research. He has written extensively on ways to best visualize data, including technical aspects of creation, design best practices, and accessible communication strategies for social science research. Through all of his work, Dr. Schwabish helps nonprofits, research institutions, and governments at all levels improve how they communicate their work and findings to their partners, constituents, and citizens. He also teaches data visualization and presentation skills at Georgetown University, American University, and in public workshops. Outside of his classes, Dr. Schwabish hosts the PolicyViz Podcast, which focuses on data, open data, and data visualization, and has written four books about data communications: Better Presentations coaches people through preparing, designing, and delivering data-rich content; Elevate the Debate helps people develop a strategic plan to communicate their work across multiple platforms and channels; and Better Data Visualizations details essential strategies to create more effective data visualizations. His most recent book, Data Visualization in Excel, hit bookshelves in May 2023 and helps readers create more effective graphs and charts in the Excel software tool. He is on Twitter @jschwabish.

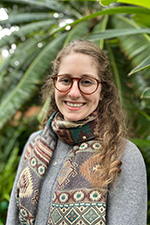
Molly Hirst holds a PhD from the University of Michigan and is a Data Curator and Data Scientist with a rich background in big data statistical analysis, visualization, and storytelling. Her work as a Data Curator at Dryad—a leading nonprofit organization dedicated to open-access data—alongside her freelance data science roles, underscores her commitment to transforming complex datasets into compelling narratives. For over a decade, Molly has honed her skills in data storytelling through publishing academic manuscripts, speaking at professional seminars, teaching diverse learners, writing blog posts, and engaging with local communities around the world. Driven by a deep belief in the transformative power of data to inform, educate, and inspire, Molly is committed to communicating the importance of using data to bridge the gap between scientific research and public understanding.

John Nerge is the GIS and Data Analysis Coordinator for the City of Brooklyn Park (MN). He loves working with maps and data analysis, in particular StoryMaps, Experience Builder, and
Dashboards. He also has experience in human-centered design and tries to keep user experience and data storytelling at the forefront of his work.

Yitong Jiang has a PhD in Spatial and Earth Sciences from Indiana State University. She is a Data & GIS Specialist at Midstory and currently is also a researcher at The University of Toledo. Her research focuses on the application of remote sensing and the geographic information system (GIS) on land surface temperature and moisture data. Her recent work has her involved with GLOBE Mission Earth, a collaboration among multiple institutions and NASA to build systemic innovation in STEM education.

Dr. Kevin Czajkowski is a Distinguished Professor of Geography and Planning at The University of Toledo. Dr. Czajkowski received his PhD from the University of Michigan in Atmospheric Sciences in 1995. He spent three years developing remote-sensing research at the University of Maryland. He came to The University of Toledo in the fall of 1998 and established a research program in remote sensing and the Geographic Information Science and Applied Geographics (GISAG) Lab. His main areas of interest are remote sensing, physical geography, and K–12 outreach. He leads a large research group investigating the use of remote sensing in water quality and urban heat island effect as well as reaching out to K–12 teachers and students. Dr. Czajkowski is principal investigator of a K–12 educational outreach program called GLOBE Mission EARTH, funded by the National Aeronautics and Space Administration (NASA) Science Activation Program, bringing authentic science experiences to K–12 students through teacher professional development and student research symposia. Through this program, he engages students and citizen scientists to study how solar eclipses affect the weather, including temperature and clouds.
