By Francie Fink
This story is part of a series on partnerships developed by the Midwest Big Data Innovation Hub with institutions across the Midwest through the Community Development and Engagement (CDE) Program.
For many Midwesterners, the impacts of climate change can feel distant, especially when compared to the more immediate threats faced by coastal regions. While Ohio may not experience the intensity of hurricanes in the Gulf, the future promises challenges like extreme heat and increased precipitation. Understanding these subtle, long-term effects often requires a closer look at data and long-term trends. And while you might not own a farming operation, your neighbors several miles south might. You wouldn’t have a way to know until seeing for yourself the trends in agricultural production over the past several decades.
Midstory, a Midwest nonprofit specializing in multimedia storytelling and research, set out to unpack trends and data addressing climate change for Ohio’s residents. The Midstory team is made up of data analysts, storytellers, and multimedia experts, all who know how to effectively communicate scientific information. Their portfolio of multimedia projects includes digital series and stories on everything from the local music scene to agriculture and homesteading in Ohio, and everything in between. They became interested in telling the story of Ohio’s changing climate in an effort to surface the gaps in information Ohio’s residents have on topics that everyone cares about, such as agriculture and air quality. Midstory embarked on a new initiative, Colors of Climate Change, to bring Ohio to the table in conversations around climate change.
Ohio’s diverse landscape is shaped by both its rural and urban populations. Home to 75,000 farms across 14 million acres and six cities with populations over 100,000, the state embodies a unique blend of lifestyles. This dynamic creates various social, political, and economic divides.
“We thought, how do we make the science or economics of climate change accessible to people? Not just accessible, but engaging,” Ruth Chang, creative director at Midstory, said.
To do this, they gathered quantitative data from various sources, including The University of Toledo and Bowling Green State University, alongside qualitative insights from interviews with policymakers, scientists, and farmers. This collaboration culminated in a permanent interactive digital series and a complementary data arts exhibit at the Toledo Lucas County Public Library.
The Midwest Big Data Innovation Hub (MBDH) partnered with Midstory to support program staff, fellows, and interns in the development of a six-part data storytelling series that explores, visualizes, and raises awareness of the current state of climate change in Ohio. The series, which included visualizations, audio episodes, and interactive maps, was a practice for Midstory in engaging with the public through a virtual medium. The team intentionally addressed six topics: (1) Ohio’s role in national climate conversations, (2) extreme weather, (3) public health, (4) agriculture, (5) economics, and (6) biodiversity.


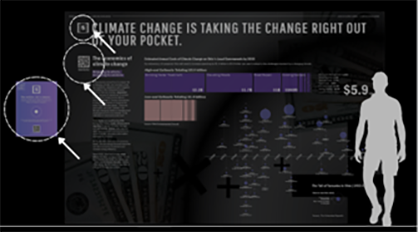
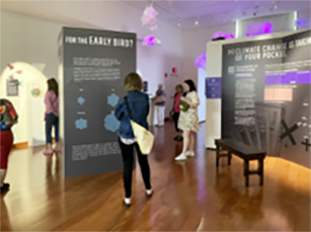
Pictured: [Left] Concept Board for the Colors of Climate Change exhibit. QR codes displayed on the physical board directed visitors to additional information and graphics online. [Right] Exhibit displayed in the Toledo Lucas County Public Library gallery. Images courtesy of Midstory.
Data can be intimidating. In its raw form, it might contain hundreds of rows of information on a single topic: say, crop yield for corn, across tens of producers, for decades. Poring over these data, even in summarized form, can be tricky, and creating a cohesive narrative from it is even trickier. Marin Warshay, Editorial Fellow with Midstory, led the writing on this ambitious project and interviewed almost 50 individuals.
“There’s always this issue of explaining what you have learned, telling other people about it . . . but not many people teach you how to do that. I’m so grateful to have the opportunity to have honed that skill. It’s been challenging but rewarding to put my own opinions aside and craft explainer-style stories from the data,” said Warshay of her involvement with Colors of Climate Change. Warshay went on to explain that while words matter, an important takeaway is that the science was already there: “The story was a way to explain the data, but the data can stand alone.”
From there, the Midstory team took on a new challenge: how to make the information viewable from a two-foot distance, accessible to all age groups and all levels of digital literacy. In Ohio, the effects of climate change will be felt disproportionately by marginalized and underserved communities. As part of Midstory’s online narrative outlines, for example, historically redlined communities in and around downtown Columbus will experience extreme heat more severely than surrounding areas. A key objective of the multipart project was to make the information available to all Ohioans. Even the location of the physical exhibit, the Main branch of Toledo’s library system, was intentionally selected to maximize accessibility.
The library exhibit, which ran from July to August 2024, was Midstory’s most extensive physical storytelling project to date. The Midstory team envisioned a space where art and science coalesced, transforming complex data into interactive experiences that drew in visitors from all demographics. The resulting exhibit exceeded the expectations of the Midstory team and project stakeholders alike. Visitors could engage with immersive installations, hands-on displays, and visual narratives. In one section of the exhibit, visitors heard a crack of thunder as they read about the increased frequency of storms expected in Ohio. In total, the exhibit featured over thirty 4′ × 8′ colorful boards that presented data, allowing guests to explore the impacts of climate change on agriculture, local ecosystems, water quality and availability, and public health. The exhibit fostered organic conversations among diverse groups, from students to farmers, creating a shared understanding of the critical issues at hand.
You can explore a 3D tour of the exhibit here.

“While media coverage often sparks nationwide conversations about climate change, we sometimes overlook how it directly impacts our local communities. When you walk into the exhibit, Ohio is the center of the story,” said Logan Sander, editorial director at Midstory.
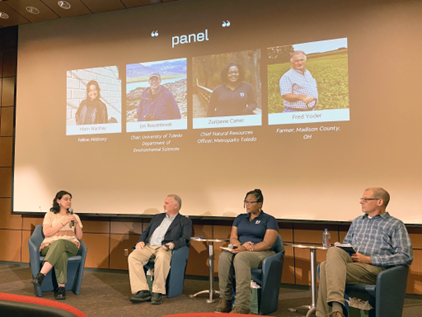
On July 27, 2024, Midstory hosted a 200-person reception called “Climate In Context,” with a panel, community tabling session, structured time for exhibit interaction, and keynote speaker, featuring Pam Dempsey, program director of the Data-Driven Reporting Project at the Northwestern University Knight Lab.

The digital series and exhibit received high praise from community members and local organizations. The Colors of Climate Change digital content has reached nearly 50,000 individuals, and almost 2,000 individuals have interacted with the physical exhibit. Midstory is excited to continue the project with support from their local community foundation. The additional funding will allow them to create and produce two additional episodes in their digital series.
Learn More/Get Involved
Explore Midstory’s Colors of Climate Change digital series here. Learn more about Midstory’s other multimedia projects here.
Contact the Midwest Big Data Innovation Hub if you’re aware of other people or projects we should profile here, or to participate in any of our community-led Priority Areas. The Midwest Big Data Innovation Hub is an NSF-funded partnership of the University of Illinois at Urbana-Champaign, Indiana University, Iowa State University, the University of Michigan, the University of Minnesota, and the University of North Dakota, and is focused on developing collaborations in the 12-state Midwest region. Learn more about the national NSF Big Data Hubs community.
