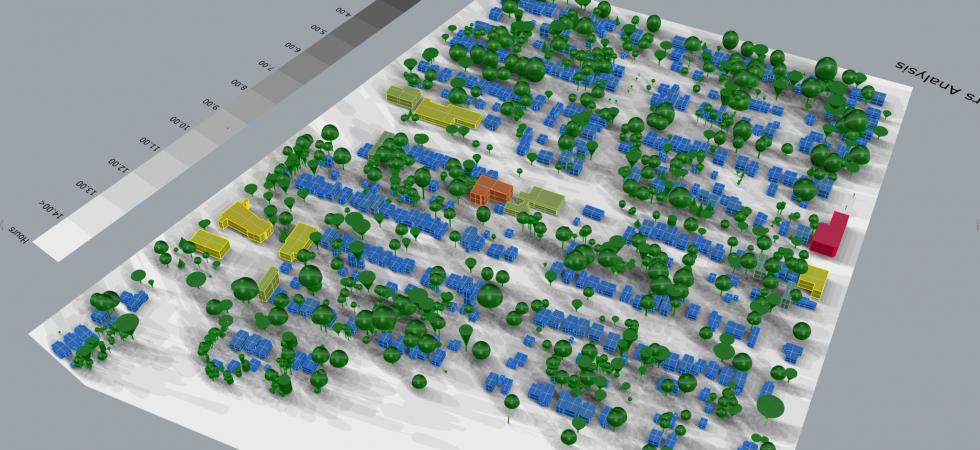
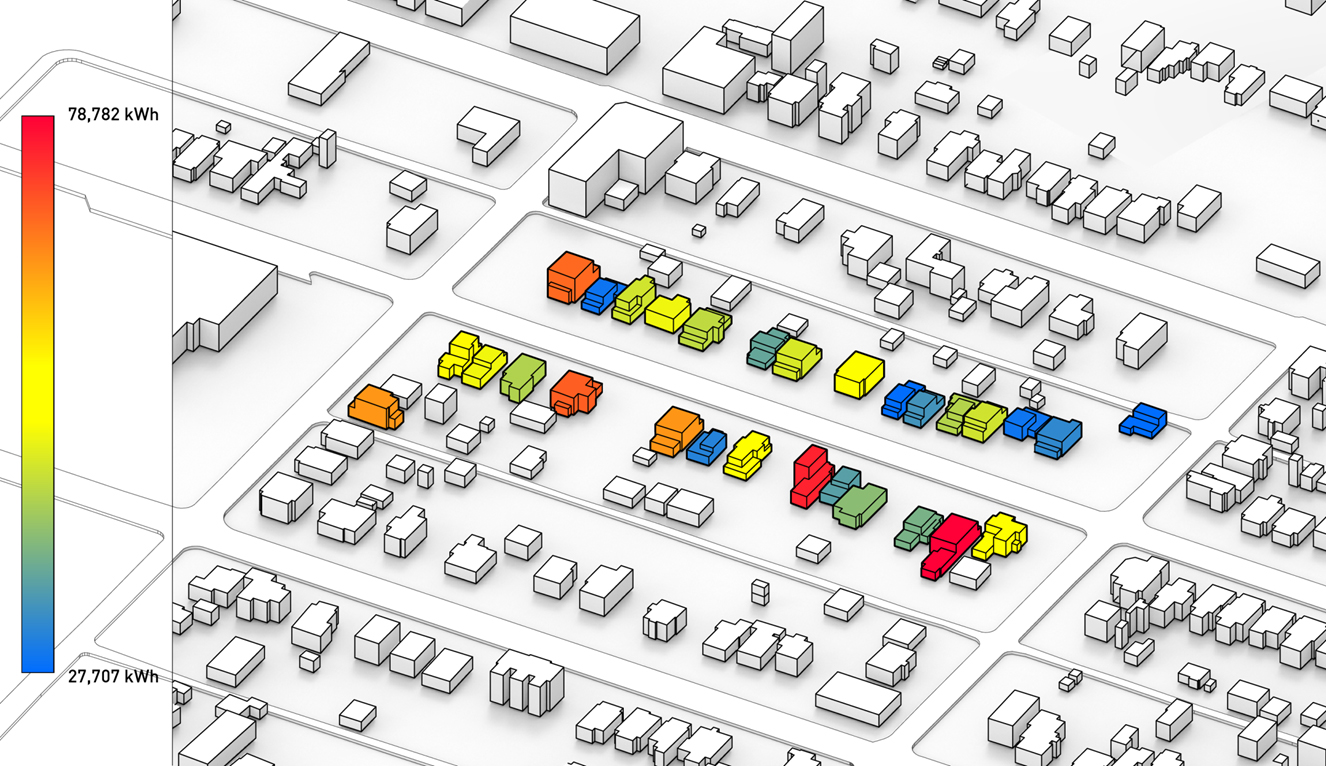
Minneapolis’ Energy Burden: An Improved Model for Determining Which Households Pay More Than Their Fair Share for Energy

By Francie Fink

This story is part of a series on partnerships developed by the Midwest Big Data Innovation Hub with institutions across the Midwest through the Community Development and Engagement (CDE) Program.

As of 2020, almost a third of American households reported difficulty in paying energy bills, or were forced to keep their home at an uncomfortable and potentially unsafe temperature to save money. With increasing summer temperatures and more extreme winter temperatures anticipated in years to come, this statistic is likely to become only more alarming. Policymakers and researchers have developed a metric to standardize which homes pay more than others towards energy bills, as a proportion of their annual household income. That metric, called a household’s “energy burden” can be calculated and expressed as a simple percentage:

(Annual money spent on energy costs)/(Annual household income) * 100.

You might now easily calculate your own household’s energy burden. You might also easily see how this proportion can be alarming: for instance, for a household making $25,000 a year with $2,000 towards energy bills in that same year, that family’s energy burden is 8%. Common standard is that 6% energy burden or higher constitutes an energy-poor household, this being the average energy burden of a household between 0–80% area median income (AMI). A tricky characteristic of this calculation for policymakers hoping to intervene is that we often don’t have accurate, accessible data on household income. This component is key in accurately estimating household energy burden and is essential for effectively directing assistance to those who need it most.

Minnesota can experience bitterly cold winters and, thus, its households rely on dependable heating. Energy bills can rack up for low-income households, particularly for those heating with expensive fuels and inefficient equipment. In the Twin Cities, for households less than 30% AMI, the average household energy burden for Minneapolis is 10%—and for St. Paul, 7%. While incoming Inflation Reduction Act funding and existing utility programs provide an opportunity for energy-efficient upgrades and bill assistance, respectively, it’s currently very difficult for administrators to know which households can benefit most. If a family is seeking assistance through Minnesota’s Energy Assistance Program, as of now, they must first find that the program exists, then fill out a somewhat lengthy application with an income-verification step. Or, if program administrators aren’t able to reach target households, these households might instead engage in risky financial behavior, such as taking on loans to keep the heat on.

A small group of researchers at the University of Minnesota’s (UMN) Center for Sustainable Building Research partnered with the Midwest Big Data Innovation Hub (MBDH) to improve the methodology of estimating household income in an effort to enable proactive outreach to families experiencing high energy burden.

“Energy burden is often addressed as something that has to have already been experienced,” says Diba Malekpour Koupaei, Research Fellow at the Center for Sustainable Building Research. “We aim to be proactive by keeping an eye out for households that may currently be experiencing it or could face this challenge in the future. This approach has the potential to increase our capacity for outreach to those most in need of intervention.”

The team, led by Malekpour, aimed to develop a framework for estimating household income using what is called the House Price-to-Income Ratio. The metric is essentially exactly what it sounds like, and its main purpose is to gauge the affordability of a home for a given family. The UMN group realized they might be able to use this metric for something else: income estimation in the context of energy burden. The value of a home might just be a good predictor of its occupants’ income.

Researchers can and frequently do use microdata, or unidentifiable, individual-level data, from open sources like the U.S. Census’ American Community Survey (ACS). The ACS has information on income, home value, and energy costs for a sample of American homes, so it can be valuable for energy-burden studies. Previous research by the UMN and other groups couldn’t identify a correlation between household income and home value within the dataset. Building on work from another study, however, the UMN team was able to use a relationship between home value and income when matching up deciles of these two metrics.

The relationship between household income and home value wasn’t a strong enough predictor when analyzing individual data points. But when the entire distribution of home values was matched on a decile basis to the distribution of incomes, a significant relationship revealed itself. When both datasets are split into equal 10% parts, a linear regression model can be established for each matched pair of deciles. For example, the lowest 10% of home values are compared to the lowest 10% of incomes, and so on up to the highest deciles. This shows the relationship between household income and home value more effectively than traditional methods.

Through some trial and error, the UMN was able to use the decile-to-decile approach to establish a relationship that can be used across the country, not just in Minnesota. In practice, this relationship can be used to estimate income at the Census block level, when geomatched with local home assessment data. Using the 6% threshold for the amount of earnings a household can spend on energy costs before becoming overburdened, the research team was able to take their findings one step further. Solving for “amount of money spent on energy costs annually” in our original energy-burden equation under 6% energy burden and a given income, one can find the maximum amount of money a household is able to spend yearly before becoming overburdened. The graph below shows that, interestingly, different neighborhoods in Minneapolis have noticeably different annual energy budgets. See, for instance, that single-family homeowners in downtown and uptown communities can spend more on energy each year before being overburdened than the Powderhorn and Phillips communities. The same, though, might not be true for those in multifamily housing.

Chart of estimated annual energy budget for different Minneapolis communities and neighborhoods
Pictured: Estimated annual energy budget (maximum annual spending on energy costs before being overburdened) for different Minneapolis communities/neighborhoods. MF= Multi-Family Dwelling; SFA = Single-Family Attached Dwelling; SFD= Single-Family Detached Dwelling

The MBDH supported Malekpour and her team’s research in 2024. The team’s work has resulted in a methodology manuscript currently in submission. The publication will come up in a lookup table and can be used anywhere as long as there is assessor data available. The assessor data will serve as a broadly available source for home value in determining the relationship to household income. The team hopes to make their methodology publicly available, potentially changing the game for energy-assistance and home-upgrade programs seeking out families vulnerable to high energy costs in relation to their earnings.

Also in the works is an interactive geographic information system (GIS) interface that uses the methodology to convey household energy budgets on a regional or even more granular scale. The interface would allow individuals to contribute their own income, home-value, and energy-cost data anonymously to hone the model. The UMN team hopes to recruit graduate students to incorporate this voluntary data in the near future.

Get Involved/Learn More

Learn more about the UMN Center for Sustainable Building Research here.

Contact the Midwest Big Data Innovation Hub if you’re aware of other people or projects we should profile here, or to participate in any of our community-led Priority Areas. The Midwest Big Data Innovation Hub is an NSF-funded partnership of the University of Illinois at Urbana-Champaign, Indiana University, Iowa State University, the University of Michigan, the University of Minnesota, and the University of North Dakota, and is focused on developing collaborations in the 12-state Midwest region. Learn more about the national NSF Big Data Hubs community.
Sense South Bend: A City’s Campaign for Transparent Environmental Metrics

By Francie Fink

This story is part of a series on partnerships developed by the Midwest Big Data Innovation Hub with institutions across the Midwest through the Community Development and Engagement (CDE) Program.

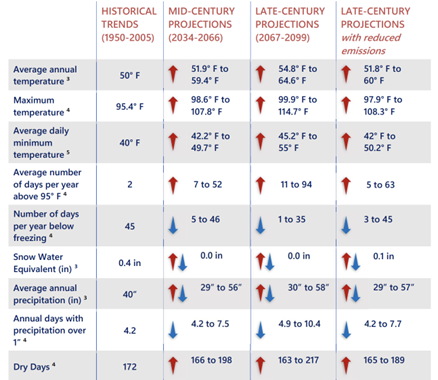
South Bend, Indiana, is starting to see the effects of climate change. In both 2016 and 2018, the city experienced devastating flooding that inundated roads and low-lying areas. According to the 2023 South Bend Climate Risk and Vulnerability Assessment, extreme heat days have steadily been increasing—with the average number of days above 95 degrees Fahrenheit projected to increase by at least 5 and at most 50 by mid-century. Most recently, though, wildfire smoke from hundreds of miles away quite literally turned the sky a different color, setting an eerie backdrop for South Bend residents struggling with respiratory issues and concern for the future of the air they breathe. Wildfire smoke and its visible threat highlighted other concerns: vehicle emissions on hot, sunny days increasing ozone levels and industrial processes releasing harmful particulate matter.

South Bend Climate Trends Snapshot
Pictured: South Bend Climate Trends Snapshot, South Bend Climate Risk and Vulnerability Assessment

The City of South Bend’s Department of Innovation and Technology and Office of Sustainability, whose missions involve improving residents’ access to technology and mobilizing residents to the climate emergency, became increasingly interested in initiating an environmental health campaign. The problem? City officials lacked real-time, hyperlocal data on air quality to inform public health interventions. Levels of primary pollutants, such as ozone and fine particulate matter, can vary substantially even within a city. This fact poses challenges for cities like South Bend, that rely on air quality readings from one state-owned regional environmental sensor. When identifying locations for cooling centers, for example, there are limited data to identify where extreme heat persists. Schools on one side of town might experience poorer air quality than those on the other on any given day and decide to postpone outdoor recess accordingly.

A new City campaign, called Sense South Bend, would accomplish three main goals:

  • • increase the collection of high-quality environmental data;
  • • inform the public on the availability of these data and actions to take during different air-quality levels;
  • • inform local public health and climate change interventions.

Alex Bazán, South Bend’s Director of Sustainability, says of the initiative “SenseSB provides on-the-ground data that will allow the City to develop policies and programming that equitably serve community members. It has provided opportunities to engage with residents and community partners to discuss air quality, climate change, and how as a community we can work together to improve quality of life.”

To obtain 24-hour air-quality readings at the neighborhood level, the City of South Bend partnered with TELLUS Networked Sensor Solutions. TELLUS’ wireless environmental sensors, when deployed, can measure over nine pollutants and related metrics. Analysis of these long-term data on particulate matter, ozone, carbon monoxide, ambient temperature, and more will allow City of South Bend officials to determine priority geographies within city limits for public programming and infrastructure to address poor air quality and associated health concerns, such as asthma and heart disease. South Bend deployed 22 sensors on city-owned assets, across city limits, over the course of Spring 2024.

Perhaps most relevant to South Bend’s ultimate goal of providing easily digestible and high-quality air-quality readings to residents, however, is TELLUS’ AirView model, which reflects a real-time interpolation of sensors. The more sensors that are deployed, the better the interpolation. The end result is a color-coded map of city air quality, ranging from healthy to hazardous.

AirView interpolation of South Bend's air quality for a given day.
Pictured: AirView interpolation of South Bend’s air quality for a given day, accessible at southbendin.gov/air-quality.

Once South Bend obtained more accurate, geographically focused data, they needed a plan to make air-quality data accessible to the public. They also wanted accompanying guidance on actions to take during air-quality emergencies. Which groups are particularly vulnerable to poor air quality? What are easy actions to reduce air pollution? Are there thresholds for joining in outdoor activities during poor air-quality events? These remained complex questions with ambiguous answers.

The City of South Bend partnered with the Midwest Big Data Innovation Hub (MBDH) through its Community Development and Engagement Program to host a Graduate Environmental Health Fellow, who, over the course of the Spring 2024 Semester, gained learning experience in research, community engagement, and science communication while helping to build out the City of South Bend’s environmental sensing initiative, aptly named Sense South Bend: Air Quality.

Francie Fink, a Master of Public Affairs candidate at the University of Wisconsin–Madison concentrating in Energy Analysis and Policy, was onboarded as the City’s Environmental Health Fellow. From January through May 2024, she conducted research that ultimately informed the creation of a public-facing webpage and accompanying knowledge-based article, social media education campaign for air quality, and supplemental outreach materials for the Sense South Bend: Air Quality initiative.

“Working with the City of South Bend in this role was an incredible experience,” said Fink, “In March, I presented on Sense South Bend to the city’s Environmental Research Coalition, a group formed to strengthen the connection between community-based scientific research and local government. They were interested in how my research complemented ongoing City efforts.”

The MBDH also supported the professional development of Barbara Dale, Project Manager in South Bend’s Office of Sustainability. Barbara attended the Health Effects Institute’s Spring Conference and brought back important insights, which were incorporated into City messaging around air quality. An important one? Often, groups most vulnerable to poor air quality, such as communities living near highways and outdoor workers, don’t necessarily consider themselves sensitive.

Francie Fink, Environmental Health Fellow, at South Bend area's Bike to Work Week in May 2024.
Barbara Dale, Project Manager in South Bend's Office of Sustainability, at the Health Effect Institute's Spring Conference in Philadelphia in April 2024.

Pictured Left: Francie Fink, Environmental Health Fellow, tables for Sense South Bend at South Bend area’s Bike to Work Week in May 2024.
Pictured Right: Barbara Dale, Project Manager in South Bend’s Office of Sustainability, attends and represents South Bend at the Health Effect Institute’s Spring Conference in Philadelphia in April 2024.


The initiative’s webpage hosts the AirView map with the Environmental Health Fellow’s findings and recommended guidance based on the following air-quality levels: good to moderate, unhealthy, very unhealthy, and hazardous. The guidance outlines sensitive groups and checks on physical activity. For instance, for residents in orange zones on the map, the air quality is unhealthy and sensitive groups, such as those with heart/lung disease and pregnant women, should make outdoor activities short and easy, monitoring symptoms for shortness of breath and heart palpitations.

Sense South Bend: Air Quality will lay the foundation for additional environmental sensing initiatives in South Bend, like Sense South Bend: Water Quality and Sense South Bend: Mobility. Already, residents have interacted with the webpage and social media posts, sharing notices of days with poor air quality and engaging in discussion around the sources of air pollution. Some residents have even expressed interest in purchasing their own TELLUS air sensor, to help improve the network of publicly available sensors.

“As climate change intensifies the challenges of poor air quality and severe heat, real-time data from sensors across the community will help us to better serve our residents,” says Patrick McGuire, Technology Equity Manager for the City of South Bend. “We can empower residents to take informed precautions for their health and drive data-driven solutions for a more resilient city.”

Get Involved/Learn More

To learn more about the Sense South Bend: Air Quality initiative, visit https://southbendin.gov/air-quality/. For more information on the Air Quality Index and related health concerns, visit AirNow.gov at https://www.airnow.gov/air-quality-and-health/. If you are interested in contributing to the network of TELLUS environmental sensors by deploying your own device and making it publicly available, visit https://www.tellusensors.com/products/.

Contact the Midwest Big Data Innovation Hub if you’re aware of other people or projects we should profile here, or to participate in any of our community-led Priority Areas. The Midwest Big Data Innovation Hub is an NSF-funded partnership of the University of Illinois at Urbana-Champaign, Indiana University, Iowa State University, the University of Michigan, the University of Minnesota, and the University of North Dakota, and is focused on developing collaborations in the 12-state Midwest region. Learn more about the national NSF Big Data Hubs community.
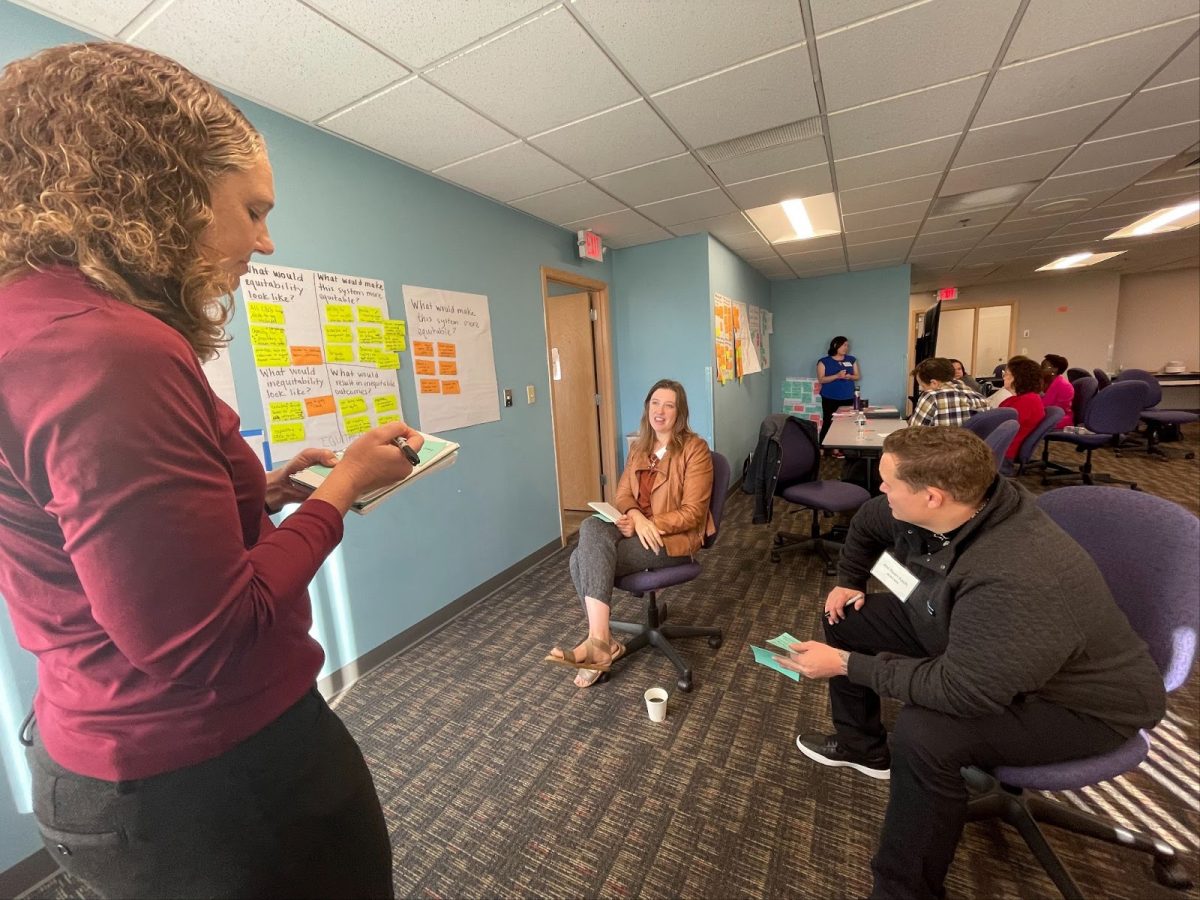
Data Meets Art: Interactive Insights for Ohio at Midstory’s “Colors of Climate Change” Exhibit

By Francie Fink

This story is part of a series on partnerships developed by the Midwest Big Data Innovation Hub with institutions across the Midwest through the Community Development and Engagement (CDE) Program.

For many Midwesterners, the impacts of climate change can feel distant, especially when compared to the more immediate threats faced by coastal regions. While Ohio may not experience the intensity of hurricanes in the Gulf, the future promises challenges like extreme heat and increased precipitation. Understanding these subtle, long-term effects often requires a closer look at data and long-term trends. And while you might not own a farming operation, your neighbors several miles south might. You wouldn’t have a way to know until seeing for yourself the trends in agricultural production over the past several decades.

Midstory, a Midwest nonprofit specializing in multimedia storytelling and research, set out to unpack trends and data addressing climate change for Ohio’s residents. The Midstory team is made up of data analysts, storytellers, and multimedia experts, all who know how to effectively communicate scientific information. Their portfolio of multimedia projects includes digital series and stories on everything from the local music scene to agriculture and homesteading in Ohio, and everything in between. They became interested in telling the story of Ohio’s changing climate in an effort to surface the gaps in information Ohio’s residents have on topics that everyone cares about, such as agriculture and air quality. Midstory embarked on a new initiative, Colors of Climate Change, to bring Ohio to the table in conversations around climate change.

Ohio’s diverse landscape is shaped by both its rural and urban populations. Home to 75,000 farms across 14 million acres and six cities with populations over 100,000, the state embodies a unique blend of lifestyles. This dynamic creates various social, political, and economic divides.

“We thought, how do we make the science or economics of climate change accessible to people? Not just accessible, but engaging,” Ruth Chang, creative director at Midstory, said.

To do this, they gathered quantitative data from various sources, including The University of Toledo and Bowling Green State University, alongside qualitative insights from interviews with policymakers, scientists, and farmers. This collaboration culminated in a permanent interactive digital series and a complementary data arts exhibit at the Toledo Lucas County Public Library.

The Midwest Big Data Innovation Hub (MBDH) partnered with Midstory to support program staff, fellows, and interns in the development of a six-part data storytelling series that explores, visualizes, and raises awareness of the current state of climate change in Ohio. The series, which included visualizations, audio episodes, and interactive maps, was a practice for Midstory in engaging with the public through a virtual medium. The team intentionally addressed six topics: (1) Ohio’s role in national climate conversations, (2) extreme weather, (3) public health, (4) agriculture, (5) economics, and (6) biodiversity.

Concept Board for the “Colors of Climate Change” exhibit
Exhibit displayed in the Toledo Lucas County Public Library gallery

Pictured: [Left] Concept Board for the Colors of Climate Change exhibit. QR codes displayed on the physical board directed visitors to additional information and graphics online. [Right] Exhibit displayed in the Toledo Lucas County Public Library gallery. Images courtesy of Midstory.

Data can be intimidating. In its raw form, it might contain hundreds of rows of information on a single topic: say, crop yield for corn, across tens of producers, for decades. Poring over these data, even in summarized form, can be tricky, and creating a cohesive narrative from it is even trickier. Marin Warshay, Editorial Fellow with Midstory, led the writing on this ambitious project and interviewed almost 50 individuals.

“There’s always this issue of explaining what you have learned, telling other people about it . . . but not many people teach you how to do that. I’m so grateful to have the opportunity to have honed that skill. It’s been challenging but rewarding to put my own opinions aside and craft explainer-style stories from the data,” said Warshay of her involvement with Colors of Climate Change. Warshay went on to explain that while words matter, an important takeaway is that the science was already there: “The story was a way to explain the data, but the data can stand alone.”

From there, the Midstory team took on a new challenge: how to make the information viewable from a two-foot distance, accessible to all age groups and all levels of digital literacy. In Ohio, the effects of climate change will be felt disproportionately by marginalized and underserved communities. As part of Midstory’s online narrative outlines, for example, historically redlined communities in and around downtown Columbus will experience extreme heat more severely than surrounding areas. A key objective of the multipart project was to make the information available to all Ohioans. Even the location of the physical exhibit, the Main branch of Toledo’s library system, was intentionally selected to maximize accessibility.

The library exhibit, which ran from July to August 2024, was Midstory’s most extensive physical storytelling project to date. The Midstory team envisioned a space where art and science coalesced, transforming complex data into interactive experiences that drew in visitors from all demographics. The resulting exhibit exceeded the expectations of the Midstory team and project stakeholders alike. Visitors could engage with immersive installations, hands-on displays, and visual narratives. In one section of the exhibit, visitors heard a crack of thunder as they read about the increased frequency of storms expected in Ohio. In total, the exhibit featured over thirty 4′ × 8′ colorful boards that presented data, allowing guests to explore the impacts of climate change on agriculture, local ecosystems, water quality and availability, and public health. The exhibit fostered organic conversations among diverse groups, from students to farmers, creating a shared understanding of the critical issues at hand.

You can explore a 3D tour of the exhibit here.

Visitors interacting with the “Colors of Climate Change” exhibit
Pictured: Visitors interacting with the Colors of Climate Change exhibit. Image courtesy of Midstory.

“While media coverage often sparks nationwide conversations about climate change, we sometimes overlook how it directly impacts our local communities. When you walk into the exhibit, Ohio is the center of the story,” said Logan Sander, editorial director at Midstory.

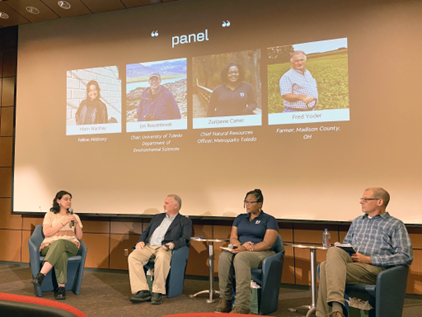
On July 27, 2024, Midstory hosted a 200-person reception called “Climate In Context,” with a panel, community tabling session, structured time for exhibit interaction, and keynote speaker, featuring Pam Dempsey, program director of the Data-Driven Reporting Project at the Northwestern University Knight Lab.

July 27 panel discussion between a university professor, parks natural resources officer, and an Ohio farmer
Pictured: July 27 panel discussion between a university professor, parks natural resources officer, and an Ohio farmer. Image courtesy of Midstory.

The digital series and exhibit received high praise from community members and local organizations. The Colors of Climate Change digital content has reached nearly 50,000 individuals, and almost 2,000 individuals have interacted with the physical exhibit. Midstory is excited to continue the project with support from their local community foundation. The additional funding will allow them to create and produce two additional episodes in their digital series.

Learn More/Get Involved

Explore Midstory’s Colors of Climate Change digital series here. Learn more about Midstory’s other multimedia projects here.

Contact the Midwest Big Data Innovation Hub if you’re aware of other people or projects we should profile here, or to participate in any of our community-led Priority Areas. The Midwest Big Data Innovation Hub is an NSF-funded partnership of the University of Illinois at Urbana-Champaign, Indiana University, Iowa State University, the University of Michigan, the University of Minnesota, and the University of North Dakota, and is focused on developing collaborations in the 12-state Midwest region. Learn more about the national NSF Big Data Hubs community.
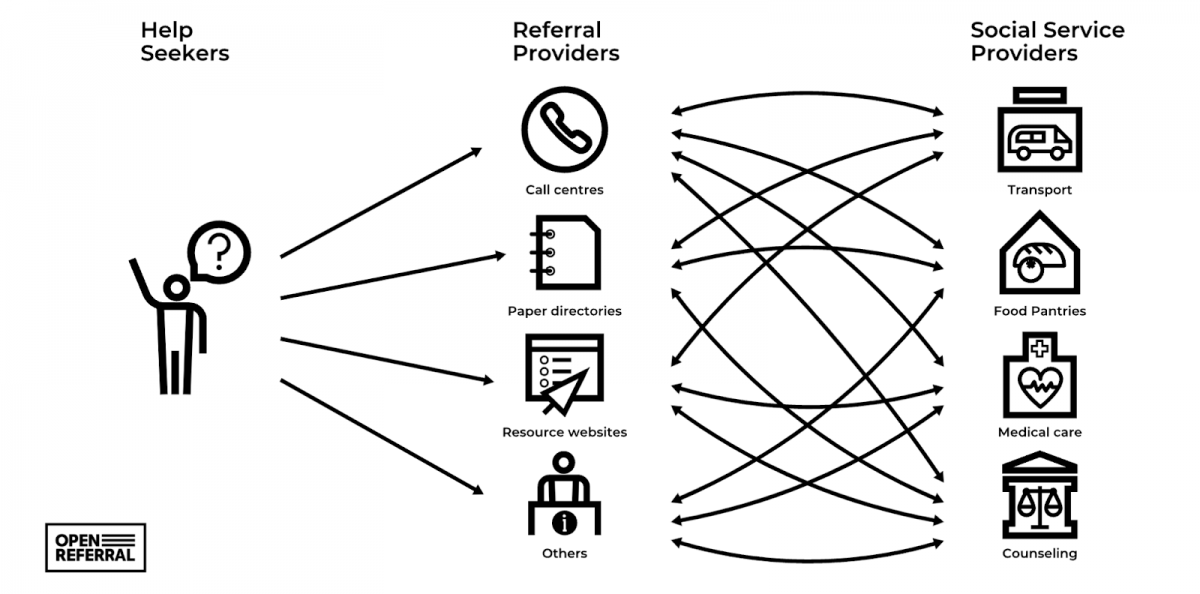
Robot Partners Revolutionizing Everyday Life For People With Disabilities

By Shruti Gosain

For a long time, robots were simple machines used mainly in factories, out of sight and performing basic, repetitive tasks. They weren’t very smart, but things are changing rapidly. Advances in machine learning are making robots smarter and more aware of their surroundings, allowing them to make better decisions. Robots are set to change the way we look at things. For instance, a refrigerator that tells us what’s inside without opening it or a voice-controlled oven that follows our commands are also functional robots making life easier.

Robots aren’t the giant creatures we see in movies. They can be small, helpful machines that assist with daily tasks, like a coffee maker, a robotic vacuum cleaner, or even an intelligent chatbot. These robots aren’t clunky machines from science fiction but practical assistants designed to blend into our daily lives. Imagine unloading groceries from your car, and this robot effortlessly takes multiple trips, carrying your bags and saving you from back-and-forth journeys. It can even function as a mobile helper, letting you load it with errands and follow you with a simple button press.

Personal-assistant robots are also being developed for outdoor use, such as delivery robots being tested on sidewalks. Companies are creating various sizes of robots for tasks like mail or food delivery. These robots use cameras to follow a designated person by tracking their feet. While the technology is still in its early stages, with challenges in obstacle detection and navigation, it shows the potential for robots to become everyday helpers.

Robots have the potential to significantly improve the lives of people who are physically challenged. For individuals with mobility issues, robotic exoskeletons can provide support and assistance, enabling them to walk and move more freely. These advanced devices can help restore independence and enhance the quality of life for those with spinal cord injuries or other mobility impairments. In addition to mobility aids, robotic assistants can perform daily tasks that may be difficult for physically challenged individuals. For example, robotic arms can help with household chores like cooking, cleaning, and fetching items. Voice-activated robots can assist in controlling home environments, allowing users to adjust lights, temperature, and appliances without needing to move.

Moreover, robots can offer companionship and emotional support. Social robots equipped with advanced communication capabilities can engage in conversations, recognize emotions, and provide interactive companionship, reducing feelings of loneliness and isolation. These robots can also remind individuals to take their medications, attend appointments, and maintain a healthy routine. In healthcare settings, robots can assist in rehabilitation exercises, providing personalized therapy and monitoring progress. This can be especially beneficial for individuals recovering from strokes or surgeries, as robots can offer consistent and precise support tailored to their needs. Robots have the potential to empower physically challenged individuals, giving them greater independence, improving their quality of life, and offering both practical and emotional support.

Further underscoring this progress, we recently visited the McKechnie Family LIFE Home at the University of Illinois at Urbana-Champaign, where we witnessed firsthand the focus on research and development efforts. These efforts target a range of topics related to in-home activities, with the aim of improving quality of life and independence for people of all ages and abilities. This holistic approach aligns perfectly with the potential of assistive robots, promoting a future where technology empowers everyone to live a fulfilling life at home. Researchers are exploring how robots can assist older adults with mobility and cognitive impairments. They gather feedback from seniors to understand their needs and preferences. Seniors interact with robots designed to pick up fallen objects and fetch items, providing valuable insights for the next phase of development. These robots will be tested in retirement communities, with the ultimate goal of seamlessly integrating into the lives of older adults and enhancing their well-being.

Future of Robots in Helping People with Disabilities

Innovations are set to transform the lives of individuals with physical and cognitive challenges, offering enhanced independence, improved quality of life, and greater inclusion in society. Robotic exoskeletons and advanced prosthetics are at the forefront of aiding those with mobility impairments. These devices can enable individuals with spinal cord injuries or limb loss to walk, climb stairs, and perform daily activities that were previously difficult or impossible. Future developments will likely make these devices more affordable, lightweight, and user-friendly, expanding their accessibility. Robots designed for home use will continue to evolve, providing crucial assistance with everyday tasks. From robotic arms that help with cooking and cleaning to automated personal assistants that manage household chores, these technologies will reduce the physical strain on individuals with disabilities. Voice-activated robots will become even more sophisticated, allowing seamless control over home environments and smart devices.

Social robots will also play a vital role in offering companionship and emotional support. Equipped with artificial intelligence (AI) to understand and respond to human emotions, these robots can engage in meaningful conversations, provide reminders for medication and appointments, and help reduce feelings of loneliness and isolation. For children with autism spectrum disorder (ASD), robots can assist in developing social and communication skills through interactive and nonjudgmental engagement.

In the realm of education, robots will offer personalized learning experiences tailored to the unique needs of students with learning disabilities. AI-powered tutors can adapt lessons based on individual progress, ensuring that students receive the support they need to succeed. Additionally, robots can facilitate inclusive classrooms by assisting with tasks such as note-taking, reading aloud, and interpreting sign language. AI-powered tools will enhance accessibility and communication for individuals with hearing or speech impairments. Advanced speech-to-text and text-to-speech applications, along with real-time translation services, will bridge communication gaps. Future robots might also incorporate sign language interpretation, making interactions smoother for those who rely on sign language. As robots take on more routine and physically demanding tasks, people with disabilities will find greater opportunities in the workforce. Assistive technologies will enable them to perform a wider range of jobs, fostering inclusion and diversity in various industries. Employers will benefit from a broader talent pool, enriched by the unique perspectives and skills of individuals with disabilities.

The future of robots in helping people with disabilities is bright, with potential to bring about significant positive changes. These advancements will not only improve the day-to-day lives of individuals with disabilities but also promote greater independence, inclusion, and overall well-being. As technology continues to evolve, the collaboration between humans and robots will become an integral part of creating a more accessible and equitable world.

What Does This Mean For Humans?

So, will robots take over the world one day? I believe that robots and advanced technologies like AI and machine learning will not replace humans! And AI isn’t poised to take over our jobs. Rather, robots will serve as everyday partners and helpers, making working with these high-tech solutions more of a collaboration than a takeover. In fact, robots are expected to make us smarter, more productive, and increasingly efficient.

In conclusion, the future of robots in aiding people with disabilities is both exciting and transformative. As technology continues to advance, robots will play an increasingly vital role in enhancing the lives of individuals with physical and cognitive challenges. From providing mobility and daily living support to offering emotional companionship and educational assistance, robots are set to revolutionize the way we approach disability care. These innovations will foster greater independence, improve quality of life, and ensure a more inclusive society. As we embrace the collaboration between humans and robots, we pave the way for a more accessible and equitable world for everyone.

Get Involved

Contact the Midwest Big Data Innovation Hub if you’re aware of other people or topics we should profile here, or to participate in any of our community-led Priority Areas. The MBDH has a variety of ways to get involved with our community and activities. The Midwest Big Data Innovation Hub is an NSF-funded partnership of the University of Illinois at Urbana-Champaign, Indiana University, Iowa State University, the University of Michigan, the University of Minnesota, and the University of North Dakota, and is focused on developing collaborations in the 12-state Midwest region. Learn more about the national NSF Big Data Hubs community.
Governing Smart Cities and the Ethical Considerations of Big Data

By Ken Ogata

From smartphones to surveillance cameras, to automatic doors and artificial intelligence, the cities we live in have become “smarter,” carrying the promise of productivity and modernization. While “smart” technology seemingly makes our lives easier, are we giving up the benefits of privacy and individualism?

In a new book, Governing Smart Cities as Knowledge Commons, edited by Brett M. Frischmann, Michael J. Madison, and Madelyn Rose Sanfilippo, experts in law, policy, and information science examine how we can properly govern “smart” cities through models based on ethical and social considerations, and information science.

With the increasing integration of technology into our daily lives, the amount of data and information that is gathered, stored, and analyzed by cities has skyrocketed.

“Residents are connected to each other and to governments and other organizations by fiber and wireless connections.” The authors of Governing Smart Cities as Knowledge Commons write in Part 1 of the book, “‘The people’ and their environments are rendered and represented digitally in the bureaucracies of public administration and in the dynamics of everyday life.”

As the role of Big Data becomes more important in city policy, data governance—the standards and regulation for the storage, usage, and disposal of data—has never been more relevant. Dr. Angie Raymond, who coauthored a chapter in the book and is a Professor of Business Law and Ethics at Indiana University, states that many cities in the United States lack the manpower and expertise to efficiently use the data collected.

“The problem a lot of cities are facing is that the skills required to use data are new,” Raymond said. “And unfortunately, cities are oftentimes well behind the curve on being able to find (well-trained) employees.”

Raymond added that many cities lack the infrastructure to store data for proper use later down the road. “The biggest issue for cities is oftentimes cities have been gathering data for a long time . . . they have a repository of data, which is oftentimes a Box folder with some security on it, and a lot of PDFs, which are incredibly difficult to be used.”

The authors also state that modern cities can get wrapped up in hype and adopt “smart” technology for the sake of modernization, not taking the time to consider what data it shares and collects and how to properly govern it.

The book notes that seemingly innocent examples of “smart” technology can have unintended consequences, such as an automatic door with a camera.

“What if the automatic door could identify people prior to opening the door? What if the automatic door could send an alert when an unauthorized person attempts to enter the building?” the authors ask in Part 4: Lessons for Smart Cities. “This requires new sensors, intelligence-generating tools and processes (identification), and automated actions . . . The camera-based system collects much more data than is needed, creating privacy risks that are easily overlooked or underestimated.”

To prevent cases like this, the authors of the book present the Governing Knowledge Commons (GKC) framework as a useful tool when evaluating the governance of smart technology. The book emphasizes the importance of comprehensive public knowledge in regard to data storage and collection, and the implementation of new smart technology across the city.

“We need to figure out a way that we can all use data to produce information, and then we’re sharing it amongst a larger community,” Raymond said. “Commons is just a fancy word for saying we all get together and we know the boundaries and have a set of rules.”

As an example of the GKC framework, Raymond brings up the Dewey Decimal system present in libraries across the country and how it could be used to set up a proper data governance topology for cities.

“It doesn’t matter what library you walk into, if you walk to the fiction section, you can find Stephen King, and (000) is the computer science section in every library all round the world,” said Raymond. “If we could ever develop an actual system where we were using similar variables with similar labels (for city data), we would be in a different place.”

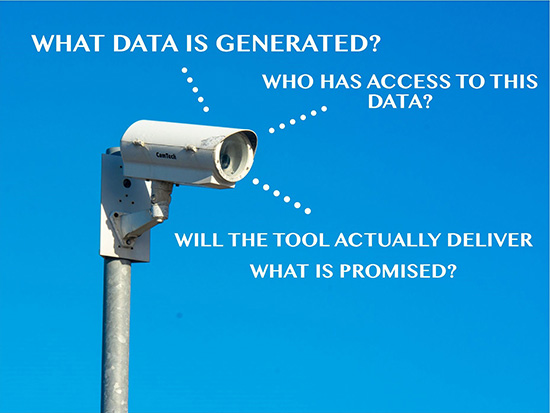
Using the GKC framework as a foundation, the authors of the book provide a set of questions that can be used by administrative governments when considering the pros and cons of installing smart technology:

Closed-Circuit Television (CCTV) camera against the blue sky, with the questions “What data is generated?,” “Who has access to this data?,” and “Will the tool actually deliver what is promised?”
Graphic by Ken Ogata; original image from Pexels/Jan van der Wolf

In the book’s concluding chapters, the authors mention in Part 4 that proper data governance requires comprehensive public knowledge and also community members that are well informed and capable of taking action and voicing concerns about data collections and city projects. “Simply put, cities aren’t smart, but the people living and working in cities might be.”

In making sure that data governance is upheld and smart technology does not infringe upon the rights of citizens, Raymond urges those capable to make sure that their voices are heard. “Citizens need to understand that if you are in the room and you have a voice, there are probably three people not in the room who don’t have a voice.”

Cities themselves can only be as smart as the people living in them. Accountability lies not only in the hands of the experts, but also the larger city community, whose job it is to make sure that we still have a voice in our cities.

Get Involved

Those interested in the Governing Knowledge Commons (GKC) framework can access the official Workshop on Knowledge Commons Website for further explanations of the framework and future projects and events.

Contact the Midwest Big Data Innovation Hub if you’re aware of other people or projects we should profile here, or to participate in any of our community-led Priority Areas. The MBDH has a variety of ways to get involved with our community and activities. The Midwest Big Data Innovation Hub is an NSF-funded partnership of the University of Illinois at Urbana-Champaign, Indiana University, Iowa State University, the University of Michigan, the University of Minnesota, and the University of North Dakota, and is focused on developing collaborations in the 12-state Midwest region. Learn more about the national NSF Big Data Hubs community.
Reshaping Agriculture in a Changing Climate with Insights from Predictive Analytics

By Shruti Gosain

We’re in a time where technology is moving faster than ever. In an age of rapidly advancing technology, the intersection of data science, climate science, and agriculture is producing game-changing results. Predictive analytics, a cutting-edge approach to data-driven forecasting, is revolutionizing our ability to foresee and respond to the challenges posed by a changing climate. It’s like having a crystal ball that helps us predict and prepare for the problems that impact society in different ways due to climate change.

The Power of Predictive Analysis in Climate Science

In the world of climate science, researchers use big sets of data from tools like satellites and weather stations. With the help of super-smart computer programs, they can make predictions about things like extreme weather and long-term climate changes. These predictions help us understand what’s happening with the Earth’s climate and get ready for changes like heat waves and storms.

Satellites and weather stations collect a huge amount of data about the weather and climate. Then, with the help of artificial intelligence and machine learning, scientists can predict things like wild weather events, seasonal changes, and long-term shifts in our climate. Now, why is this exciting? Well, think about it: These predictions are like knowing the future, but for the weather. Farmers can use this information to figure out when to plant their crops. If they know there will be a dry spell, they can be ready with extra water. And when we’re talking about big events like hurricanes or floods, predictive analytics helps us get ready—by strengthening our buildings or planning better emergency responses. The case studies in the table below this article illustrate this in more detail.

Predictive Analytics Reshaping the Future of Agriculture

Now, let’s talk more about farming. Farmers rely on the weather and the climate to grow their crops. But with increasing heat and more frequent droughts impacting yields in many growing areas, things are getting tricky. Predictive analytics steps in to help. It looks at large amounts of information like past climate data, how healthy the soil is, and how different crops are doing. Then, it tells farmers when to plant, what to plant, and how much they’ll get when it’s time to harvest. This is what’s called “precision agriculture,” where we use data to be more precise in how we grow food.

Agriculture is inherently dependent on climate, making it one of the sectors most vulnerable to climate change. Predictive analytics offers a lifeline to farmers. By analyzing historical climate data, soil health, and crop performance, predictive models can provide insights into optimal planting times, crop selection, and yield projections. The data-driven decisions enabled by predictive analytics reduce risks, enhance resource management, and increase productivity. For example, in regions facing water scarcity, predictive models can suggest the most efficient irrigation strategies to minimize water wastage. This technology is revolutionizing precision agriculture, optimizing the use of resources and minimizing environmental impact.

Imagine a farmer in a place where it’s superhot and there isn’t much rain. Predictive analytics tells them the best time to plant their crops and how much water to use so they don’t waste any. This means more food on our plates and less waste. So, it’s not just about scientists making cool predictions; it’s about using those predictions to make our world safer and smarter. It’s like having a heads-up about the future and, with that, we can plan better, adapt to change, and protect our planet. Climate science and predictive analytics are like our secret weapons against the unpredictable weather and they’re here to save the day!

Let’s look at a real-life example. In California’s wine country, vineyard managers use predictive analytics to know when to prune the vines, when to water them, and when to pick the grapes. This makes their vineyards strong and good for the environment. The integration of predictive analytics in climate science and agriculture is not just a forward-thinking idea; it’s a necessity in a world facing escalating environmental uncertainties.

Future, Necessities, and Challenges in the Path to Predictive Analytics Mastery

While predictive analytics holds immense promise, challenges exist. The accuracy of predictions depends on the quality and quantity of data, which can be influenced by factors such as data collection infrastructure and access to satellite technology. Additionally, ensuring that predictive models are accessible to farmers, particularly in developing regions, is a critical challenge.

As we look to the future, addressing these challenges is paramount. The integration of predictive analytics in climate science and agriculture is not a luxury but a necessity. It equips us to tackle the evolving climate crisis with proactive strategies, ensuring food security, environmental sustainability, and resilience in the face of uncertainty. Moreover, fostering collaboration between researchers, policymakers, and technology innovators will be essential in harnessing the full potential of predictive analytics to address the pressing challenges of our times.

Conclusion

Predictive analytics is the bridge between knowledge and action in the realms of climate science and agriculture. As we continue to refine these predictive models and make them more accessible, we inch closer to a world where our responses to climate change are not reactions but anticipations, where agriculture adapts seamlessly to shifting climate conditions, and where we collectively move towards a more sustainable and resilient future.

Get Involved

Contact the Midwest Big Data Innovation Hub if you’re aware of other people or topics we should profile here, or to participate in any of our community-led Priority Areas. The MBDH has a variety of ways to get involved with our community and activities. The Midwest Big Data Innovation Hub is an NSF-funded partnership of the University of Illinois at Urbana-Champaign, Indiana University, Iowa State University, the University of Michigan, the University of Minnesota, and the University of North Dakota, and is focused on developing collaborations in the 12-state Midwest region. Learn more about the national NSF Big Data Hubs community.
Predictive Analytics Case Studies

Precision Farming for Sustainable Agriculture
Issue: In a region experiencing increasingly erratic weather patterns, farmers faced the daunting task of optimizing crop production while conserving resources and adapting to changing conditions. [Sources: 1, 2]    Solution: Predictive analytics tools were used to analyze historical climate data, soil quality, and crop performance. Using machine-learning algorithms, these tools forecasted ideal planting times and crop varieties as well as recommended precise irrigation schedules. By relying on data-driven decisions, farmers were able to enhance productivity, conserve water, and reduce the environmental footprint of their operations.  
Hurricane Tracking and Preparedness
Issue: Coastal communities were grappling with the increasing frequency and intensity of hurricanes, which necessitated better preparation and response strategies. [Sources: 1, 2]  Solution: Predictive analytics models were developed to track and predict hurricane paths and intensities. These models integrated data from satellites, weather stations, and historical hurricane data. The predictive analytics system provided more accurate forecasts, allowing authorities to issue timely evacuation orders, prepare emergency shelters, and allocate resources effectively. This resulted in improved safety for vulnerable communities during hurricane events.
Climate-Resilient Urban Planning
Issue: Urban areas were facing the dual challenge of population growth and climate change, leading to increased vulnerability to extreme weather events and flooding. [Sources: 1, 2]Solution: Predictive analytics played a pivotal role in urban planning. By analyzing climate data and topography, predictive models identified flood-prone areas and forecasted future vulnerabilities. Urban planners used this information to make informed decisions about infrastructure development, flood defenses, and emergency response plans. This proactive approach ensured that cities were better equipped to handle extreme weather events and protect their citizens.

Cultivating Change: Finding Answers with Sustainable Urban Farming

By Sasha Zvenigorodsky

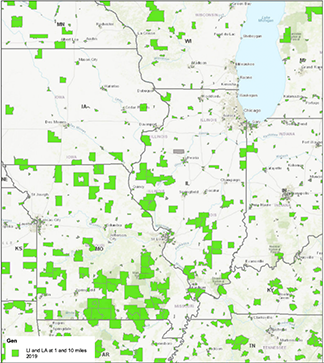
2019 USDA Food Access Research Atlas, showing the frequency of food deserts throughout the Midwest. The atlas indicates areas where a significant number of residents live more than 1 mile (urban) or 10 miles (rural) from the nearest supermarket.
USDA Food Access Research Atlas, 2019
Low-income census tracts where a significant number or share of residents is more than 1 mile (urban) or 10 miles (rural) from the nearest supermarket.

Most individuals native to Illinois would be shocked to hear that thousands of its residents reside in areas that are considered to be deserts. Not literal deserts, but rather food deserts, urban areas in which it is difficult to buy good-quality or affordable food. Although food deserts aren’t covered by dry sand and hot sun, both types of “deserts” have one glaring similarity: hostile living conditions due to lack of food resources. The 2019 USDA Food Access Research Atlas (at right) demonstrates the frequency of food deserts throughout the Midwest, indicating areas where a significant number of residents live more than 1 mile (urban) or 10 miles (rural) from the nearest supermarket. As food accessibility issues are exacerbated by climate change, these food deserts have the potential to grow even more expansive.

The Midwest Climate Summit concluded in late February, a three-day event hosted by the Midwest Climate Collaborative (MCC; led from Washington University in St. Louis), with the purpose of gathering climate leaders, researchers, and other interested parties to address the escalating issue of climate change and promote new partnerships and collaborations. The Summit hosted multiple speakers and workshops, with topics ranging from agroforestry and silviculture to designing a circular economy.

All these topics have the same main goal: addressing climate change. Here, we explore one session that highlighted the critical impacts of climate change on food accessibility within Illinois. As global warming brings on intense weather fluctuations throughout the United States, standard agricultural practices are jeopardized and traditional farmers are thrown into uncertainty. Without solutions to this issue, food deserts throughout urban areas are likely to expand.

Hosting a panel that included a small regenerative farm, a family orchard, and a beekeeper, the Midwest Climate Summit introduced just that: solutions—specifically, the concept of urban farming.

Urban farming entails both the cultivation and distribution of agricultural products within urban and suburban areas. Hydroponic/aquaponic facilities, community gardens, and rooftop farms are all examples of urban farming. These methods have excellent potential to provide healthy, fresh foods to underserved areas with limited nutritional access. They also address climate change in big ways. For example, various urban-farming methods can utilize less water, less light, and less soil than traditional farming can, proving to be more sustainable and climate-friendly.

The ability to educate and raise awareness on issues like climate change and food insecurity is a big reason why panels like the Midwest Climate Summit are so important. Nonetheless, they are often missing an important target audience: children. Promoting the importance of local urban food systems to school-age children can be the key to establishing more sustainable and environmentally friendly communities over time.

This is demonstrated perfectly by the Gardeneers organization of AmeriCorps. AmeriCorps is an independent agency of the United States government that engages Americans in service positions through stipended volunteer work organizations. One such organization, called Gardeneers, involves urban-farming education targeted towards underprivileged children living in urban food deserts within Chicago. Their mission is to help create a more equitable food system with the help of specialized school garden and farm programs within Chicago’s South and Westside schools. These programs can equip kids with the proper knowledge and skills to positively contribute to the environment and their communities.

“Climate change leaves these kids facing an uncertain future,” says Galina Fesseler, Gardeneers volunteer. “Educating kids about food accessibility and urban farming is a great way to invest in their health and development.”

Food is just one dimension of the larger impact that climate has on a region. Other sessions at the Midwest Climate Summit addressed related topics, such as water and health, which affect people in communities, and shared a wealth of information and resources that communities can use to help with climate resilience.

In collaboration with the MBDH, the MCC developed a prototype Climate Asset Map (CAM), which is an online interface that will help groups from different disciplines and sectors to access and contribute to climate-action information throughout the Midwest, such as information surrounding urban farming. The MCC received feedback from across the Midwest to a survey about information needs that researchers, practitioners, government agencies, and community groups have around climate-related resources. This informed the development of the CAM prototype, which was presented at the Summit for attendees to explore. The model was then refined and has just launched as the Midwest Climate Resource Network (CRN).

Urban farming is just one small example of the many ways to address climate change, hence the need for the CRN. With the help of this resource, organizations like Gardeneers can be interconnected with other groups throughout the Midwest, allowing for collaboration and collective success within the various realms of climate work.

Get Involved

Contact the MBDH if you’re aware of other agriculture- or food-related people or projects we should profile here, or to participate in any of our community-led Priority Areas. The MBDH has a variety of ways to get involved with our community and activities.

The Midwest Big Data Innovation Hub is an NSF-funded partnership of the University of Illinois at Urbana-Champaign, Indiana University, Iowa State University, the University of Michigan, the University of Minnesota, and the University of North Dakota, and is focused on developing collaborations in the 12-state Midwest region. Learn more about the national NSF Big Data Hubs community.
New NSF Convergence Accelerator Midwest disability-related awards

By Aisha Tepede

The National Science Foundation (NSF) has taken a new approach to build upon basic research and discovery to accelerate solutions toward societal impact by providing award funds to academic institutions across the USA with the opportunity to develop research projects.

Individuals who have disabilities deal with hindrances restricting them from achieving better economic opportunities, quality of life, health, and wellness. The NSF’s Convergence Accelerator program enables universities and nonacademic institutions to develop solutions to address societal challenges through convergence research and innovation within a collaborative and multidisciplinary effort. Recently, the program made 16 awards under its Track H: “Enhancing Opportunities for Persons with Disabilities,” including 6 in the Midwest. The transdisciplinary program builds upon basic research to develop new technologies and accelerate novel solutions that can address challenges faced by persons with disabilities.

One arena of the opportunities includes accessibility for those who are visually impaired.

Saint Louis University, in partnership with nonprofit and industry collaborators, received funding for a program that focuses on those with blindness or visual impairments (BVI). The program aims to address the disparities seen among the BVI population. With many members being disproportionately unemployed, unable to travel independently, and limited in furthering their education, this program aims to bridge the gap and create inclusive approaches to information access and strengthening inclusion among those with disabilities.

Another team focusing on visual impairment is led by Wichita State University, with collaborators at Kansas State University and Georgia Tech. In order to address national health and welfare, the team is fostering the formation of MABLE (Mapping for Accessibility in BuiLt Environments). The design is meant to allow those with visual and mobile impairments to navigate spaces through digital accessibility maps of indoor environments. Innovations such as these create vital opportunities for people with disabilities to foster daily practices of independence and develop new frameworks for quantifying economic benefits.

Other researchers in the Midwest are doing related work on visual accessibility. Professor JooYoung Seo serves as the Director of the Accessible Computing Lab in the School of Information Sciences at the University of Illinois at Urbana-Champaign (UIUC). “One of the ongoing projects in our lab is the development of an accessible data visualization system, particularly designed for blind and low-vision users,” Seo said. “This system leverages multimodalities like sound, speech, and braille to allow users to explore and analyze data. This project is of paramount importance, particularly in today’s digital era where data literacy is a crucial skill for everyone. By creating an accessible data visualization system, we are providing equitable access to visual information and contributing to data literacy for all individuals, regardless of their dis/abilities. This project illustrates our commitment to designing technology that is inclusive and supportive of everyone’s data needs.”

Seo also serves as senior personnel on the Delta high-performance computing (HPC) project, funded by NSF and led from the National Center for Supercomputing Applications at UIUC. Seo’s role involves identifying and addressing accessibility issues. “Our goal is to improve the interface to make it more inclusive for users with disabilities. The essence of this project lies in its potential to transform accessibility in the realm of high-performance computing. In a field where high efficiency and speed are paramount, we must also remember that true innovation should be accessible to all. Delta strives to break down barriers and create an environment that is equally beneficial and inclusive for all users, regardless of their abilities. This project underscores the principle that every user, regardless of their abilities, should be able to utilize technology with ease.”

The impact these projects have on people with disabilities is invaluable as well as for those who work in the field or plan to. Addison Graham is a fourth-year undergraduate student at Illinois State University (ISU) studying Special Education—Specialist in Low Vision and Blindness, with a Certificate in Early Intervention (SED w/ LVB Cert. in EI) and the president of ISU’s Braille Birds. The group is a registered student organization (RSO) that fosters education and spreads awareness about the blind and visually impaired community.

As an incoming educator in Special Education, Addison states,

            “With innovations like MABLE filling the need for greater ease-of-use navigational accessibility indoor of buildings, individuals with and without visual impairments could greatly benefit from the mandated reporting of a building’s interior design.”

Other teams receiving NSF awards under the Convergence Accelerator program include Michigan State University, Purdue University, and Northwestern University, which focus on projects for individuals who have speech impediments or are hearing impaired and create mobility independence for individuals with motor impairments. Projects such as these open opportunities to increase wellness and navigational accessibility for persons with disabilities.

To see a more in-depth description of each research project being conducted at various universities across the USA, see the table below.

Although the awardees each have different approaches and scopes of involvement of opportunities for persons with disabilities, there is a shared interest in synergizing work through facilitated collaboration in order to cultivate improved situations of development for marginalized populations. The Midwest Big Data Innovation Hub (MDBH) provides a venue for outreach and engagement that increases the potential for benefitting society and the themes seen with the institution’s awards. Collaborations with MDBH foster the use of data in developing solutions to enhance the quality of life and employment opportunities for persons with disabilities. These and other activities address topics that bring together diverse perspectives that open solutions for persons with disabilities.

Get Involved

Contact the Midwest Big Data Innovation Hub if you’re aware of other people or projects we should profile here, or to participate in any of our community-led Priority Areas. The MBDH has a variety of ways to get involved with our community and activities.

The Midwest Big Data Innovation Hub is an NSF-funded partnership of the University of Illinois at Urbana-Champaign, Indiana University, Iowa State University, the University of Michigan, the University of Minnesota, and the University of North Dakota, and is focused on developing collaborations in the 12-state Midwest region. Learn more about the national NSF Big Data Hubs community.
Summary of new NSF Convergence Accelerator Midwest disability-related awards

Bridging the Fragmentation of Information Access – An Integrated, Multimodal System for Inclusive Content Creation, Conversion, and Delivery (Saint Louis University)This project aims to address information access as a consolidated initiative to create a unified framework for authoring accessible materials.
Convergent, Human-Centered Design for Making Voice-Activated AI Accessible and Fair to People Who Stutter (Michigan State University)This project aims to resolve limitations in voice technology by developing and implementing policy, advocacy, and AI-based solutions to make voice technology accessible and fair to people who stutter.
Developing Experiential Accessible Framework for Partnerships and Opportunities in Data Science (for the deaf community) (Purdue University)This project aims to create strategic initiatives to overcome barriers and biases that deaf individuals face in the workplace for deaf learners in order to teach data science content.
Leveraging Human-Centered AI Microtransit to Ameliorate Spatiotemporal Mismatch between Housing and Employment for Persons with Disabilities (Wayne State University)This project aims to promote disability inclusion in workplaces by enhancing the availability and reliability of paratransit services by delivering an open-source human-centered Artificial Intelligence (AI) technology that aids microtransit services.
Mobility Independence through Accelerated Wheelchair Intelligence (Northwestern University)This project aims to accelerate the accessibility and utility of power wheelchairs by leveraging practical machine intelligence to enhance safety and facilitate independent wheelchair operation.
Towards a Community-Driven Framework for the Creation and Impact Analysis of Digital Accessibility Maps with Persons with Disabilities (Wichita State University)This project aims to use MABLE (Mapping for Accessibility in BuiLt Environments) to provide digital accessibility maps of indoor environments with an interface for assessing, planning, and navigating, based on the affordances and capabilities of the user.

Building a Climate Asset Map with the Midwest Climate Collaborative

By Sasha Zvenigorodsky

This story is part of a series on partnerships developed by the Midwest Big Data Innovation Hub with institutions across the Midwest through the Community Development and Engagement (CDE) Program.

Climate change—two words that have become increasingly popular throughout the scientific community as the world begins to see its destructive impacts across the globe. Though the rise in climate concerns for the future may appear to be a source of fear and uncertainty, many scholars, researchers, and academic organizations have regarded it as more of a call to action. This is where the Midwest Climate Collaborative (MCC) comes in.

Midwest Climate Collaborative Logo

The Midwest Climate Collaborative is headquartered at Washington University in St. Louis, Missouri, directed by Heather D. Navarro. This program is exclusive to a 12-state region in the Midwest and serves as a coordinating group for cross-sector responses to the ongoing climate crisis, with the objective of spreading knowledge about the issue as well as encouraging leadership and cross collaboration between various organizations to address the problem.

The MCC is a relatively new organization that was launched following the conclusion of a Think Tank series that was centered around outreach and engagement for climate action. By the end of the series, it was apparent that there is a plethora of great climate work being done across different institutions throughout the Midwest. Despite this, there are issues in their ability to connect and achieve collective success. Thus, participating Think Tank partners came together to craft strategies and objectives for the MCC, which was ultimately launched in January of 2022.

Throughout this past year, the MCC has established a variety of different strategic projects. One, launched in collaboration with the Midwest Big Data Innovation Hub (MBDH), is called the Climate Asset Map (CAM). This project has a goal of helping audiences such as researchers, practitioners, and community groups to easily access and contribute to climate action information that already exists in the region.

Currently, many governments and nongovernmental organizations (NGOs) local to the Midwest have limited resources to find and implement the latest climate research. The CAM serves to bridge this gap via an online, user-friendly interface. The assets of CAM could include data sets, research labs, training programs, and more. “Above all, I want this project to encourage people to invest in the Midwest,” says MCC Executive Director Heather Navarro.

As of now, the CAM group is moving forward in conducting a needs assessment survey with the help of a funded partnership with the MBDH. The needs assessment survey will help with the development of the CAM by determining which resources would be most beneficial for potential users to achieve success within their climate work. The survey results will be shared at the Midwest Climate Summit in February 2023, and will be distributed electronically over email and social media.

Although the fight against climate change is not an easy one, the MCC has worked as a catalyst to create a strong, interconnected Midwest region, which will certainly make it easier.

Get Involved

Contact the MBDH if you’re aware of other people or projects we should profile here, or to participate in any of our community-led Priority Areas. The MBDH has a variety of ways to get involved with our community and activities.

The Midwest Big Data Innovation Hub is an NSF-funded partnership of the University of Illinois at Urbana-Champaign, Indiana University, Iowa State University, the University of Michigan, the University of Minnesota, and the University of North Dakota, and is focused on developing collaborations in the 12-state Midwest region. Learn more about the national NSF Big Data Hubs community.

MBDH Partners on New Data Science Workshop for Underrepresented High School Students

By Aisha Tepede

This story is part of a series on partnerships developed by the Midwest Big Data Innovation Hub with institutions across the Midwest through the Community Development and Engagement (CDE) Program.

Deciding what to do after high school can be overwhelming. There are various academic and career options that are provided but many students may feel uncertain and unprepared to make those big decisions. In central Michigan, high school students from several rural towns have the opportunity to learn about data science concepts for future careers at a summer workshop cosponsored by Central Michigan University and the Midwest Big Data Innovation Hub (MBDH).

Central Michigan University (CMU) holds inclusivity as core to its mission. According to the CMU mission, vision and values site, the institution prides itself on inclusion, and the student body and faculty “thrive on student-centered education and fostering personal and intellectual growth to prepare students for productive careers, meaningful lives, and responsible citizenship in a global society.”

The university’s dedication to growth goes beyond its current students and into its larger local community. With the institution having a strong and historic relationship with the Saginaw Chippewa Indian Tribe, the partnership allows for the advancement and improvement of community members’ quality of life. With Native Americans being underrepresented at major points in the academic data science pipeline, it speaks volumes that the university is seeking collaboration to engage with high school students early in their career planning and help them understand potential career paths in data science.

Mohamed Amezziane
Mohamed Amezziane

After seeing the lack of programming geared toward at-risk high school students in the community, CMU faculty members, Dr. John E. Daniels and Dr. Mohamed Amezziane developed a proposal to create a data science workshop for high school students from underrepresented and tribal communities. Daniels and Amezziane stated, “We wish to target students who are unsure about their future but might not be considering college due to financial issues or uncertainty in a major. Often, these students come from underrepresented groups and are overlooked as potential university students.”

With support from the MBDH, CMU will partner with several high schools in rural central Michigan to offer a 5-day summer workshop at CMU, introducing approximately 35 rural and underrepresented high school students to data science. Participants, including student members of the local Ojibwa Tribe, will be recruited with the support and recommendations of their local high schools.

Upon completion of the workshop, students will be more familiar with data science, will analyze data using open-source statistical software (R), and will learn how to prepare and give a professional presentation summarizing their assigned research project. The context of the assigned learning modules and project will be on making healthy lifestyle choices (nutrition, alcohol/drugs). Data used in the workshop will come from selected sources, such as the National Health and Nutrition Examination Survey (NHANES). According to the website, NHANES is a resource that consists of demographic, socioeconomic, dietary, and health-related questions designed to assess the health and nutritional status of adults and children in the United States.

Central Michigan University’s Data Science program was started 18 months ago and is attempting to generate interest among the local student population. The flexibility and versatility of data science provide an opportunity to attract and recruit students who might not fit the typical college-prep template. Not only does the program hope to foster students’ interest in data science but the CMU Admissions staff will also offer assistance to students on how to apply to data science programs, fill out Free Application for Federal Student Aid (FAFSA) financial aid forms, and address possible application barriers that would prevent students from completing a successful admission application.

Through best practices and student feedback from this 5-day program being evaluated, there are plans to make this a yearly event. Overall, the university hopes to see an increase in the number of students pursuing Data Science as a major at CMU or other regional colleges and universities. In addition, by personalizing the data sets, Daniels believes the students will connect how using statistical software could be used to make better decisions in their own lives.

John Daniels
John E. Daniels

Our workshop will focus on making healthy lifestyle choices,” Daniels said. “Instead of preaching about smoking, drinking, or texting while driving, we hope to use data science as a vehicle to demonstrate the consequences of one’s lifestyle choices and at the same time learn about all of the tools and techniques data science has to offer. The methods we will be teaching can be applied to a variety of research questions and data sets. Perhaps this will inspire some students to recognize the value of data science and to pursue it in higher education.”


Joseph (Jeff) Inungu

Dr. Jeff Inungu, CMU Professor and Director of the Master of Public Health Program, believes that by using the lens of public health and data science, “Experience and integrative learning offer students opportunities to gain skills that are highly desirable and prepare them to become leaders who are able to meet the ever-changing challenges of promoting, protecting, and enhancing the health of vulnerable communities.”

Regarding the long-term goals for the workshop, Daniels says, “Overall, the program will continue to focus on data science, reinforce the healthy lifestyle context, and gradually increase the number of workshop participants. The desired outcome is a steady increase in data science majors in our geographic area.”

When the workshop concludes, the team will work with the MBDH to assess the impact of the project and make resources available for faculty at other institutions to use in developing similar events on their campuses.

Get Involved

This work is supported by the National Science Foundation through the MBDH Community Development and Engagement (CDE) Program.

Contact the MBDH to learn more, or if you’re aware of other people or projects we should profile here. We invite participation in any of our community-led Priority Areas. The MBDH has a variety of ways to get involved with our community and activities.

The Midwest Big Data Innovation Hub is an NSF-funded partnership of the University of Illinois at Urbana-Champaign, Indiana University, Iowa State University, the University of Michigan, the University of Minnesota, and the University of North Dakota, and is focused on developing collaborations in the 12-state Midwest region. Learn more about the national NSF Big Data Hubs community.
Data Science for the Public Good Young Scholars Program

By Isabel Alviar

Data is the new science; it has the potential to answer the world’s problems if the right questions are asked. And some data science education programs are now focusing on working with local communities to help with real-world problems.

The Data Science for the Public Good (DSPG) Young Scholars Program is an immersive summer program that engages students from across Iowa to work together on projects that address social issues in the world today. Both graduate and undergraduate students are selected through a competitive statewide search. Graduate students (fellows) lead, support, and guide students together with Iowa State University (ISU) faculty and research associates, while undergraduate students (interns) acquire programming and statistical analysis experience through formal training and practical applications.

Working in teams, fellows and interns collaborate with project stakeholders and research faculty across disciplines. Research teams combine disciplines including statistics, data science, and the social and behavioral sciences to address complex problems proposed by local, state, and nonprofit agencies. Some of the program highlights for scholars include: expert training in tools for quantitative computing and data visualization (R, GIS, Tableau, etc.); professional training through workshops, seminars, and career talks; individualized mentors working closely with students; technical reporting and publication opportunities; and opportunities to interact with decision-makers in local communities, nonprofits, and state government agencies.

This past summer’s DSPG Program ran from May 23 to August 5. In light of COVID-19 and to accommodate non-ISU students, the program was held entirely online. Nonetheless, DSPG Scholars were provided the same opportunities to develop a professional portfolio, expand their networks, and learn about practical applications of data science to solving real-world problems. At the end of the summer, scholars got to present their research at the Annual DSPG Symposium. The symposium featured several distinguished keynote speakers and poster presentations by the Young Scholars. Final presentations for the 2022 DSPG Program were held on Thursday, August 4 via Zoom and recordings are available on ISU’s website.

The program is led every year by five land-grant universities and funded, in part, by the US Department of Agriculture (USDA) National Institute of Food and Agriculture (NIFA) to create a coalition for the public good. Christopher Seeger, one of the professors leading Iowa State’s program, said, “Ultimately, this is a community service. We let the community drive the conversation, while we listen to what they want and how we can help.” All of the projects were built upon a model called the Community Learning through Data Driven Discovery Process (CLD3), and helped local communities tackle real problems. Projects were incredibly diverse, with topics ranging from wholesale local food benchmarking to evaluating indicators for equal local housing needs to creating interactive commodity reports for agricultural marketing.

A webinar that further highlighted some of these projects and the DSPG Program was hosted by the Midwest Big Data Innovation Hub on October 27, 2022. Matthew Voss, Rural Policy Data Analyst for the Public Science Collaborative, featured a project from his summer as a graduate fellow where his team created analytics and dashboards to help a nonprofit organization, Eat Greater Des Moines (EGDM), more effectively target, locate, and expand food rescue in Central Iowa. Their client came to them because they had an abundance of data but did not know how to use it to answer crucial questions posed by their board, such as where people are experiencing the most food insecurity, which distribution sites have the greatest losses due to food waste, etc. This is where the DSPG Scholars stepped in. For their project, the students cleaned the large data sets and then used them to develop sustainable pipelines in Google Sheets and Google Data Studio that visually answered EGDM’s questions through interactive dashboards. The project is now published on the nonprofit organization’s website, where the DSPG team is directly credited for all of their work.

Voss’s project was just one example of how the DSPG Young Scholars Program is making a positive impact on the community while also teaching students valuable data science skills. Two other DSPG fellows, Kelsey Van Selous and Harun Çelik, also presented their projects on the webinar. Dr. Cassandra Dorius, Associate Professor of Human Development and Family Studies, and a founding co-director of the DSPG Program, said, “Students were very creative and motivated, and produced great analytics and projects. We are excited to see how this work improves people’s lives moving forward.”

Get Involved

Contact the MBDH to learn more, or if you’re aware of other people or projects we should profile here. We invite participation in any of our community-led Priority Areas. The MBDH has a variety of ways to get involved with our community and activities.

The Midwest Big Data Innovation Hub is an NSF-funded partnership of the University of Illinois at Urbana-Champaign, Indiana University, Iowa State University, the University of Michigan, the University of Minnesota, and the University of North Dakota, and is focused on developing collaborations in the 12-state Midwest region. Learn more about the national NSF Big Data Hubs community.
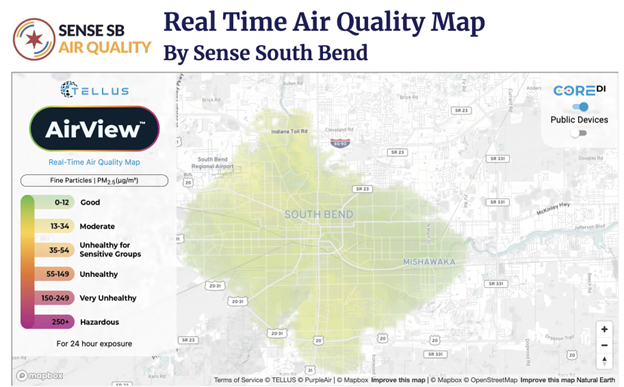
Physics-Based Machine Learning for Sub-Seasonal Climate Forecasting

By Raleigh Butler

We’ve all heard the old adage that if you don’t like the weather in the Midwest, wait a minute and it will change. So how can we possibly forecast conditions weeks in advance?

In 2019, an NSF collaborative grant was awarded to six institutions to sponsor the study of sub-seasonal climate forecasting (SSF)—with machine learning (ML). This topic addresses three core themes of the Midwest Big Data Innovation Hub—resilient communities, digital agriculture, and cyberinfrastructure. A project of the NSF Harnessing the Data Revolution (HDR) program, this award was to researchers at the following six universities: University of Minnesota–Twin Cities, University of Chicago, University of Wisconsin–Madison, Carnegie Mellon University, George Mason University, and the University of Illinois at Urbana-Champaign.

What is Sub-Seasonal Climate Forecasting?

Sub-seasonal climate forecasting focuses on predicting weather 2–8 weeks away. Interestingly, this is an area of higher difficulty than other types of forecasting. As the research team states on its website, “SSF is considered more challenging than either weather forecasting or even seasonal forecasting.” This effort ties ML together with agriculture in an effort to make these difficult predictions.

Computing’s Place in Forecasting

What is ML compared with deep learning (DL)? Machine learning builds methods for machines to “learn” or change their procedures based on input over time. Deep learning is a specific type of ML and is based on how the human brain operates.

In the linked article below from the SSF team, some difficulties in building models are discussed. Many of these difficulties are tied to the relationship between ML and physics. Therefore, systems have been created for physics-guided ML and ML-enhanced physics. Here’s what some of these systems take into account to overcome the difficulties:

  • • Physics-guided ML takes physics into account to produce output (such as forces affecting movement of clouds, gravity in rainfall, etc.). Unfortunately, existing data that includes physics-related information is limited.
  • • The other approach is ML-enhanced physics. One example of this, among many, is the Monte Carlo Tree Search (MCTS). The MCTS works by applying a hierarchical partition tree to the data. By using this approach, the program follows the sub-“branches” that are most likely in a given situation to produce a prediction. In short, the MCTS works as a decision tree and is optimized to predict the most likely path down each branch with each decision. A visual is provided in the image below.

Drawing of a decision-tree flowchart. Photo by Kelly Sikkema.
Credit: Unsplash, Kelly Sikkema

Sub-Seasonal Agriculture

How does this tie into agriculture? First, we will examine the key planning that takes place during sub-seasonal periods. According to a graph on the SSF project site, these are some important decisions that are made during those periods:

  • Maritime Planning: Designate ship routing
  • Agriculture: Schedule planting
  • Agriculture: Irrigate and apply nutrients
  • Emergency Management: Pre-stage emergency supplies
  • Aviation: Plan evacuations and sorties
  • Water Resources: Manage reservoir levels for flood control
  • Energy: Plan for spikes in energy demand

Making these decisions is a delicate process; there is a high price to pay if predictions are incorrect. Increasing the ability to accurately forecast sub-seasonally is, of course, monetarily valuable; however, it is also valuable in terms of product production and delivery.

These studies have resulted in several scientific publications since the conclusion of the funding. One of these papers, published by many team members of the original study, is published here (available for download as a pdf). The paper, published in June 2020, discusses challenges, analyses, and advances associated with ML climate forecasting. The paper includes several diagrams of how various models predict sub-seasonal weather differently. The models also discuss forecasting in various climate zones (over the ocean, and different areas over land).

Scientists are still collecting data to use as input for the models and to increase accuracy. As mentioned, this area of forecasting is more difficult than forecasting over time horizons that are nearer or further away. Although climate prediction may still be difficult, there is progress being made in the field. The paper mentioned above states, “Overall, XGBoost and Encoder (LSTM)-Decoder (FNN) perform the best. Qualitatively, coastal and south regions are easier to predict than inland regions (e.g., Midwest).”

Get Involved

Learn more about the SSF project on their site.

Contact the Midwest Big Data Innovation Hub if you’re aware of other people or projects we should profile here, or to participate in any of our community-led Priority Areas. The MBDH has a variety of ways to get involved with our community and activities. The Midwest Big Data Innovation Hub is an NSF-funded partnership of the University of Illinois at Urbana-Champaign, Indiana University, Iowa State University, the University of Michigan, the University of Minnesota, and the University of North Dakota, and is focused on developing collaborations in the 12-state Midwest region. Learn more about the national NSF Big Data Hubs community.
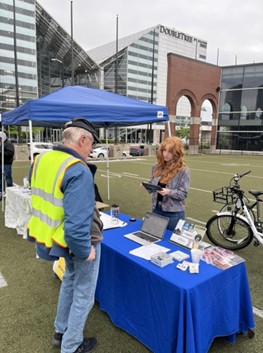
University of Nebraska researchers extend smart rural bridge health initiatives

By Raleigh Butler

Did you know that, despite increases in technology, bridge health across the United States is decreasing? Bridges currently score a C on the country’s infrastructure report card, which is a fall from last year’s grade.

Within the Midwest, the percentage of structurally deficient bridges per state include the following:

  • • Iowa has the largest percentage, 19.0%.
  • • Minnesota has the smallest percentage, 4.7%.

The Midwest Big Data Innovation Hub’s Smart & Resilient Communities priority area spans a range of disciplines, sectors, data, and cyberinfrastructure in its work to connect researchers and practitioners focused on community resilience. Bridges play key roles in community planning, resilient supply chains for food and goods, and in transportation capacity management.

Foundations

In 2018, a new regional innovation center project, “Smart Big Data Pipeline for Aging Rural Bridge Transportation Infrastructure (SMARTI),” was funded by a $1 million National Science Foundation (NSF) grant. The grant was aimed toward “rural bridge health management” and included faculty from both the University of Nebraska–Lincoln (UNL) and University of Nebraska Omaha (UNO). The work began with a planning grant in 2016, and both awards were part of the NSF’s Big Data Spoke program, in collaboration with the regional Big Data Innovation Hub program.

The principal investigator for the project, Robin Gandhi, is from UNO’s College of Information Science and Technology. The 16 research team members also include Daniel Linzell and Chungwook Sim, both from UNL’s College of Engineering.

The SMARTI project focused on “mining existing data sets from private, state and federal partners, as well as collect[ing] new data through sensors on targeted rural bridges throughout Nebraska.” The outputs of this work were presented through workshops and made available to researchers through the Bridging Big Data website.

“Our government and industry partners can better manage their aging rural bridges, improve their health and ultimately keep people safe using data and tools developed from our research,” said Robin Gandhi. “We continue to engage stakeholders through companion research projects and by presenting our work at relevant technical meetings and conferences. For example, we will be presenting at the Midwest Bridge Preservation Partnership, the American Society of Civil Engineers Structures Congress in April, and the International Association for Bridge Management and Safety Conference in July 2022.”

Student engagement

Six students from both the Lincoln and Omaha campuses who are working on these projects presented their research in October 2021 at the Midwest Big Data Innovation Hub’s Regional Community Meeting, with a focus on the data sets and data science tools that are important to this work. Recordings of their presentations are available on the MBDH YouTube channel.

Next steps

Approximately three years after the start of the SMARTI project, the Nebraska team was awarded $5 million by the Department of Defense Army Corps of Engineers for research to extend the lifespan of bridges through new monitoring technology. This award was announced in October 2021.

The researchers will continue with their work on bridge safety. The team will use rural Nebraska as testbeds for locations to safely collect data, as well as to analyze “socio-technical impacts such as fairness of data, algorithms, and analysis; and intelligent decision-making and support systems.”

“This project brings bridge owners, designers, and builders, big data solution providers, and academics together to discuss data-informed bridge infrastructure health and resilience in times of crisis,” said Daniel Linzell. “Attendees at our last workshop heard from several stakeholders about the pandemic’s impact on bridge infrastructure resilience from design, sensing, economic, and socio-political perspectives. Discussions such as these keep the research team focused on the importance of the work: developing sensing and big data technology applications that support smart, resilient, big data pipelines for aging rural bridge transportation infrastructure; highlighting solutions to data discovery and controlled sharing challenges; and unveiling novel data-driven decision-making tools.”

Get involved

New activities to build the community of Midwest researchers and practitioners in the Smart & Resilient Communities priority area of the Midwest Big Data Innovation Hub are beginning in spring 2022. Contact the Midwest Big Data Innovation Hub if you’re interested in participating, or aware of other people or projects we should profile here. The MBDH has a variety of ways to get involved with our community and activities.

The Midwest Big Data Innovation Hub is an NSF-funded partnership of the University of Illinois at Urbana-Champaign, Indiana University, Iowa State University, the University of Michigan, the University of Minnesota, and the University of North Dakota, and is focused on developing collaborations in the 12-state Midwest region. Learn more about the national NSF Big Data Hubs community.
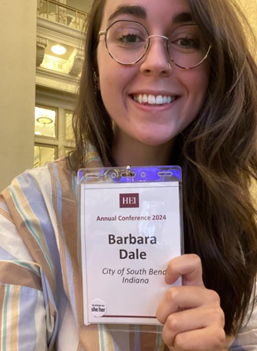
Professor Kimberly Zarecor on Community-Based Research and Building Interdisciplinary Research Teams

By Qining Wang

An expert in Eastern European Architecture, Professor Kimberly Zarecor tells us about her journey of building a highly interdisciplinary research team that takes data science into research on rural communities in Iowa.

Kimberly Zarecor

To some, architectural history and data science research may sound like oil and water—two fields that are almost impossible to mix well. However, Kimberly Zarecor, professor of Architecture at Iowa State University (ISU), leads her research team to create the perfect emulsion of many seemingly unrelated fields: sociology, statistics, industrial design, data science, architecture, and beyond.

With a research focus on small and shrinking communities in rural Iowa, not only does the team uncover the community efforts that keep some of these towns thriving, but the team is also offering the broader research community a valuable lesson on how to bring a wide range of expertise to projects and how experts from different fields can work together in harmony.

Zarecor found her inspiration to study Iowa’s shrinking towns from Ostrava, in the Czech Republic, a city she studied during her PhD research and later lived in for a semester as a Fulbright scholar. “[Ostrava] was part of a study in Europe called the Shrink Smart project, where [researchers] were looking at Ostrava as a shrinking post-industrial European city and questioned how to manage the governance of a relatively large city in the context of population loss.” As Zarecor shifted her primary research focus from architectural history in Eastern European cities to rural population loss in the Midwest, she realized the concept of shrinking smart could also be applied.

Zarecor and her collaborators started exploring the data-science component of shrinking smart with funding from a Smart & Connected Communities planning grant from the National Science Foundation (NSF) in 2017. Researchers at Iowa State University have been collecting data about the quality of life in small Iowa towns through the Iowa Small Town Poll since 1994, but “nobody had ever brought a data-science mindset to the analysis of [this] data.” The sociologists who had been collecting the data did not “think of [the poll] as a large set” and had not thought to build “a predictive model” from it.

Zarecor invited a computer scientist to be part of the planning grant team to transform the Small Town Poll data into training data, from which they could construct models to understand and predict the factors that influence people’s perceptions of quality of life in small rural communities. “We realized that what we were trying to understand is what are the actions that people in communities take as inputs into a system that results as outputs on the other side, as increases in perceptions of quality of life,” Zarecor explained. The planning grant team, consisting of a computer scientist, a sociologist, a community and regional planner, and two architects, found that “the best way to define [rural smart shrinkage] is that you are actively pursuing specific activities that you as a community can do together” that contribute to improved perceptions of quality of life even as population loss continues.

In 2020, Zarecor received another NSF grant of $1.5 million to continue this research and investigate strategies to address the data deficit in shrinking rural communities.

As the scope of the research expanded, so has Zarecor’s team. In addition to Zarecor and rural sociologist David Peters, who was also a Co-PI on the planning grant, the team now includes a community economic development specialist and a community arts specialist from ISU Extension and Outreach (both are also faculty in the College of Design at Iowa State), an industrial design faculty member, masters students from industrial design and community and regional planning, and for the data science work, three statistics faculty and three statistics PhD students. The Iowa League of Cities is also a partner on the project.

Coming to data science with little technical understanding, Zarecor approaches the data science component more from an intuitive rather than conceptual perspective: “It’s not that I understand the statistics, but I understand [the goals] as we go step by step . . . [and] the power of the tools that [the statisticians] are building.”

To lead such a highly interdisciplinary team, Zarecor thinks of herself as a bridge-builder within the team. Zarecor helps the members of her team understand data science by asking questions in a way that they can elicit responses that deepen the understandings of the nontechnical team members. “I like having that [bridge] function because it’s asking questions as a way of learning. For me, just the conversations with the data scientists helped me to better understand the data science part of our project.”

And the bridge function goes both ways. In addition to helping non-data-science experts learn more about the potential of data science, Zarecor also cultivates data scientists’ ability to contribute to projects that are community-based. “When it comes to community-based work, the assumption that this is not an expertise of its own is something that’s a challenge for the field, because doing work in communities is its own expertise,” Zarecor explained. Even though the residents in rural Iowa are the direct beneficiaries of the work from Zarecor’s team, the knowledge gap with respect to finding and using data makes those benefits inaccessible to some residents. Meanwhile, data scientists often lack the skills to convey their findings to an audience outside their academic circle. “As a field, data science, in my opinion, has not done a good job to educate necessarily well-rounded [data scientists].”

To overcome this bottleneck, Zarecor’s team works on creating dashboards that visualize the data and make the data more interpretable to the rural communities. Zarecor also encourages the statisticians on her team to talk to residents of the communities they study and ask what kind of data they would like to have. “When we ask what they want, it’s not because they know everything that’s available. We’re doing a mix of hearing from them what they want, and also guessing some things that they probably don’t know are out there that we can also give them in a usable form.”

Zarecor believes that similar types of highly collaborative and interdisciplinary research would benefit the entire research community, and those collaborations start with abandoning assumptions of different fields.

She gives an example in the discipline of architecture, where architects would assume themselves to be capable of doing graphic design or planning. Many don’t realize that those tasks are outside of their expertise even though these fields are seemingly adjacent. “And I would transfer that over to data scientists who know that data science is a synthetic and integrative discipline. [. . .] It doesn’t mean, though, that there are not all of these soft skills, all of this other communication, and people-related aspects of the data science work that you can handle without help.”

Therefore, Zarecor suggests that data scientists should work in conjunction with domain experts to make their research more relatable to a broader audience. Team members also need to respect the importance and specificity of other kinds of expertise beyond the technical or data-driven parts of a project. When a team successfully works this way, “the data science gets improved and amplified and becomes more useful. If you actually think horizontally on the project, you know that there’s not a pyramid, but that you are a team that’s working across the group [of collaborators]. This would be a much healthier way of [working with] data and for data scientists to interact with people.”

In this regard, Zarecor noted that the Midwest Big Data Innovation Hub, as a highly integrated and inclusive organization, has the potential to cultivate different layers of collaboration across various disciplines. “But it does require the data scientists who were the first audience, or the more explicit audience [for the Hub], to be willing to open up.”

Get Involved

New community-building activities in the Smart & Resilient Communities priority area of the Midwest Big Data Innovation Hub are beginning in spring 2022. Contact the Hub if you’re interested in participating, or are aware of other people or projects we should profile here. The MBDH has a variety of ways to get involved with our community and activities

The Midwest Big Data Innovation Hub is an NSF-funded partnership of the University of Illinois at Urbana-Champaign, Indiana University, Iowa State University, the University of Michigan, the University of Minnesota, and the University of North Dakota, and is focused on developing collaborations in the 12-state Midwest region. Learn more about the national NSF Big Data Hubs community.
How Do Scientists Help AI Cope with a Messy Physical World?

By Qining Wang

When we see a stop sign at an intersection, we won’t mistake it for a yield sign. Our eyes recognize the white “STOP” letters printed on the red hexagon. It doesn’t matter if the sign is under sunlight or streetlight. It doesn’t matter if a tree branch gets in the way or someone puts graffiti and stickers on the sign. In other words, our eyes can perceive objects under different physical conditions.

A stop sign. Photo by Anwaar Ali.
Photo by Anwaar Ali via Unsplash

However, identifying road signs accurately is very different, if not more difficult, for artificial intelligence (AI). Even though, according to Alan Turning, AIs are systems that can “think like humans,” they can still present limitations in mimicking the human mind, depending on how they acquire their intelligence.

One of the potential hurdles is to correctly interpret variations in the physical environment. Such a limitation is commonly referred to as an “adversarial example.”

What Are Adversarial Examples?

Currently, the most common method to train an AI application is machine learning, a type of AI process that helps AI systems learn and improve from experience. Machine learning is like the driving class an AI needs to take before it can hit the road. Yet machine-learning-trained AIs are not immune to adversarial examples.

Circling back to reading the stop sign, an adversarial example could be the stop sign turning into a slightly darker shade of red at night. The machine-learning model captures these tiny color differences that human eyes cannot discern and might interpret the signs as something else. Another adversarial example could be a spam detector that fails to filter a spam email formatted like a normal email.

Just like how unpredictable individual human minds can be, it is also difficult to pinpoint the exact origin of what and why machine learning makes certain predictions. Neither is it a simple task to develop a machine-learning model that comprehends the messiness of a physical world. To improve the safety of self-driving cars and the quality of spam filters, data scientists are continuously tackling the vulnerabilities in the machine-learning processes that help AI applications “see” and “read” better.

What Are Humans Doing to Correct AI’s Mistakes?

To defend against adversarial examples, the most straightforward mechanism is to let machine-learning models analyze existing adversarial examples. For example, to help the AI of a self-driving car to recognize stop signs under different physical circumstances, we could expose the machine-learning model that controls the AI to pictures of stop signs under different lightings or at various distances and angles.

Google’s reCAPTCHA service is an example of such a defense. As an online safety measure, users need to click on images of traffic lights or road signs from a selection of pictures to prove that they are humans. What users might not be aware of is that they are also teaching the machine-learning model what different objects look like under different circumstances at the same time.

Alternatively, data scientists can improve AI by teaching them simulated adversarial examples during the machine-learning process. One way is to implement a Generative Adversarial Network (GAN).

GANs consist of two components: a generator and a discriminator. The generator “translates” a “real” input image from the training set (clean example) into an almost indistinguishable “fake” output image (adversarial example) by introducing random variations to the image. This “fake” image is then fed to the discriminator, where the discriminator tries to tell the modified and unmodified images apart.

The generator and the discriminator are inherently in competition: The generator strives to “fool” the discriminator, while the discriminator attempts to see through all its tricks. This cycle of fooling and being fooled repeats. Both become better at their own designated tasks over time. The cycle continues until the generator outcompetes the discriminator, creating adversarial examples that are indistinguishable to the discriminator. In the end, the generator is kept to defend against different types of real-life adversarial attacks.

AI Risks and Responses

GANs can be valuable tools to tackle adversarial examples in machine learning, but they can also serve malicious purposes. For instance, one other common application of GANs is face generation. This so-called “deepfake” makes it virtually impossible for humans to tell a real face from a GAN-generated face. Deepfakes could result in devastating consequences, such as corporate scams, social media manipulation, identity theft, or disinformation attacks, to name a few.

This shows how, as our physical lives become more and more entangled with our digital presence, we can never neglect the other side of the coin while enjoying the benefits brought to us by technological breakthroughs. Understanding both would serve as a starting point for practicing responsible AI principles and creating policies that enforce data ethics.

Tackling vulnerabilities in machine learning matters, and so does protecting ourselves and the community from the damage that those technologies could cause.

Learn More and Get Involved

Curious whether you can tell a real human face from a GAN-generated face? Check out this website. And keep an eye out for the Smart & Resilient Communities priority area of MBDH, if you wish to learn more about how data scientists use novel data science research to benefit communities in the Midwest. There are also several NSF-funded AI Institutes in the Midwest that are engaged in related research and education.

Contact the Midwest Big Data Innovation Hub if you’re aware of other people or projects we should profile here, or to participate in any of our community-led Priority Areas. The MBDH has a variety of ways to get involved with our community and activities.

The Midwest Big Data Innovation Hub is an NSF-funded partnership of the University of Illinois at Urbana-Champaign, Indiana University, Iowa State University, the University of Michigan, the University of Minnesota, and the University of North Dakota, and is focused on developing collaborations in the 12-state Midwest region. Learn more about the national NSF Big Data Hubs community.
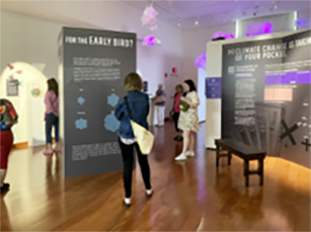
Guest post – Diverse programs from ISU address sustainable cities challenges

By Iowa State University’s Sustainable Cities team

Researchers with the Sustainable Cities team at Iowa State University recognize the difficulty that public officials face in transforming vast amounts of climate and energy research into contextualized public policy. In attempting to address this critical issue, the team’s mission goes beyond the creation of new climate analysis tools to also investigate new methods for integrating communities into the discourse of data creation and energy conservation. To accomplish this agenda, our team engages in various research avenues that range from the creation of new spatial-data tools to enabling community youth activism. Here are just a few highlights of the team’s most recent achievements:

Sustainable Cities’ team leader Ulrike Passe, associate professor of architecture, presented our hybrid physics data modeling framework at the National Science Foundation-sponsored Research Coordination Networking (RCN) workshop held at Carnegie Mellon University on May 17, 2018. The presentation, which capstones one of the major branches of the Sustainable Cities initiatives, demonstrated the integration of our recently developed thermo-physical data simulator with our research into human energy-use behavior to demonstrate how a more holistic neighborhood energy model could be constructed. This same model was presented by graduate research assistant Himanshu Sharma at the fifth High Performance Building’s Conference on July 9, 2018, at Purdue University.

image from Krejci et al. (2016)

The Community Growers Program, a public-engagement initiative started back in March of 2017, has become another core pillar of the Sustainable Cities group research. Spanning a course of eight weeks, researchers worked with 22 leadership-minded youth in the Baker Chapter of the Boys and Girls Club at Hiatt Middle School in Des Moines, Iowa, to create a community garden based on a methodology of spatial, socio-technical storytelling. Through this process, the youth participants were able to learn more about their community through access to geographic information system (GIS) and spatial mapping tools. Associate English professor Linda Shenk, our community engagement lead, and Mallory Riesberg, a collaborator with the Baker Chapter of the Boys and Girls Club, presented this methodology in a presentation titled, “Fostering the Next Generation of Big Data Scientists and Sustainable City Planners” at The Growing Sustainable Communities Conference in Dubuque, Iowa, on Oct. 4, 2017. Team members Linda Shenk, Passe and Alenka Poplin, assistant professor of community and regional planning, would later be published in the 35th Journal of Interaction Design and Architectures for the inclusion of this work in their entry, titled, Engaging Youth with Pervasive Technologies for Resilient Communities.

Poplin, an established researcher in the field of geo-spatial mapping, also leads a research group that seeks to understand how to better develop feedback loops through innovative user-interfaces. An inquiry into mapping places of emotional power was highlighted in a 2017 paper entry to the second edition of Kartographische Nachrichten on Empirical Cartography Journal, titled, “Mapping Expressed Emotions: Empirical Experiments on Power Places.” More recently, Poplin and her researcher team have begun testing an energy survey game they have developed called E-Footprints. The framework of this game includes the extraction of user-performance data to measure and analyze what learning opportunities may help guide more environmentally efficient decision making. This feedback is then generated back into learning mini-games throughout the game, such that the user gets more “energy savvy” as they play. This project begins field-testing in November 2018.

With a diverse, multifaceted research team of nearly 50 members, the Sustainable Cities group continues to advance the capabilities of communities and cities to think sustainably about a better future.


Image reference:

Krejci, C. C., Passe, U., Dorneich, M. C., & Peters, N. (2016), “A Hybrid Simulation Model for Urban Weatherization Programs”, Proceedings of the 2016 Winter Simulation Conference, Arlington, VA, December 11–14. T. M. K. Roeder, P. I. Frazier, R. Szechtman, E. Zhou, T. Huschka, and S. E. Chick, eds. (pdf)


Read more about the MBDH’s Smart, Connected, and Resilient Communities initiatives.

MBDH partners on US Ignite Reverse Pitch challenge

part of Hub’s focus on Smart, Connected, and Resilient Communities

US Ignite Hackathon
UIUC collaborators and mentors meet with HackIllinois teams on US Ignite Challenge

The University of Illinois at Urbana-Champaign (UIUC) was awarded a $20,000 grant from US Ignite to host a Smart Gigabit Communities Reverse Pitch Challenge. The MBDH, along with other local partners (see below), contributed towards matching the grant, bringing to $40,000 the total resources available to support the development of smart gigabit applications for the benefit of the local community. Read More